Immigrants from South Eastern Asia vs Samoan Master's Degree
COMPARE
Immigrants from South Eastern Asia
Samoan
Master's Degree
Master's Degree Comparison
Immigrants from South Eastern Asia
Samoans
14.0%
MASTER'S DEGREE
11.9/ 100
METRIC RATING
223rd/ 347
METRIC RANK
11.5%
MASTER'S DEGREE
0.1/ 100
METRIC RATING
298th/ 347
METRIC RANK
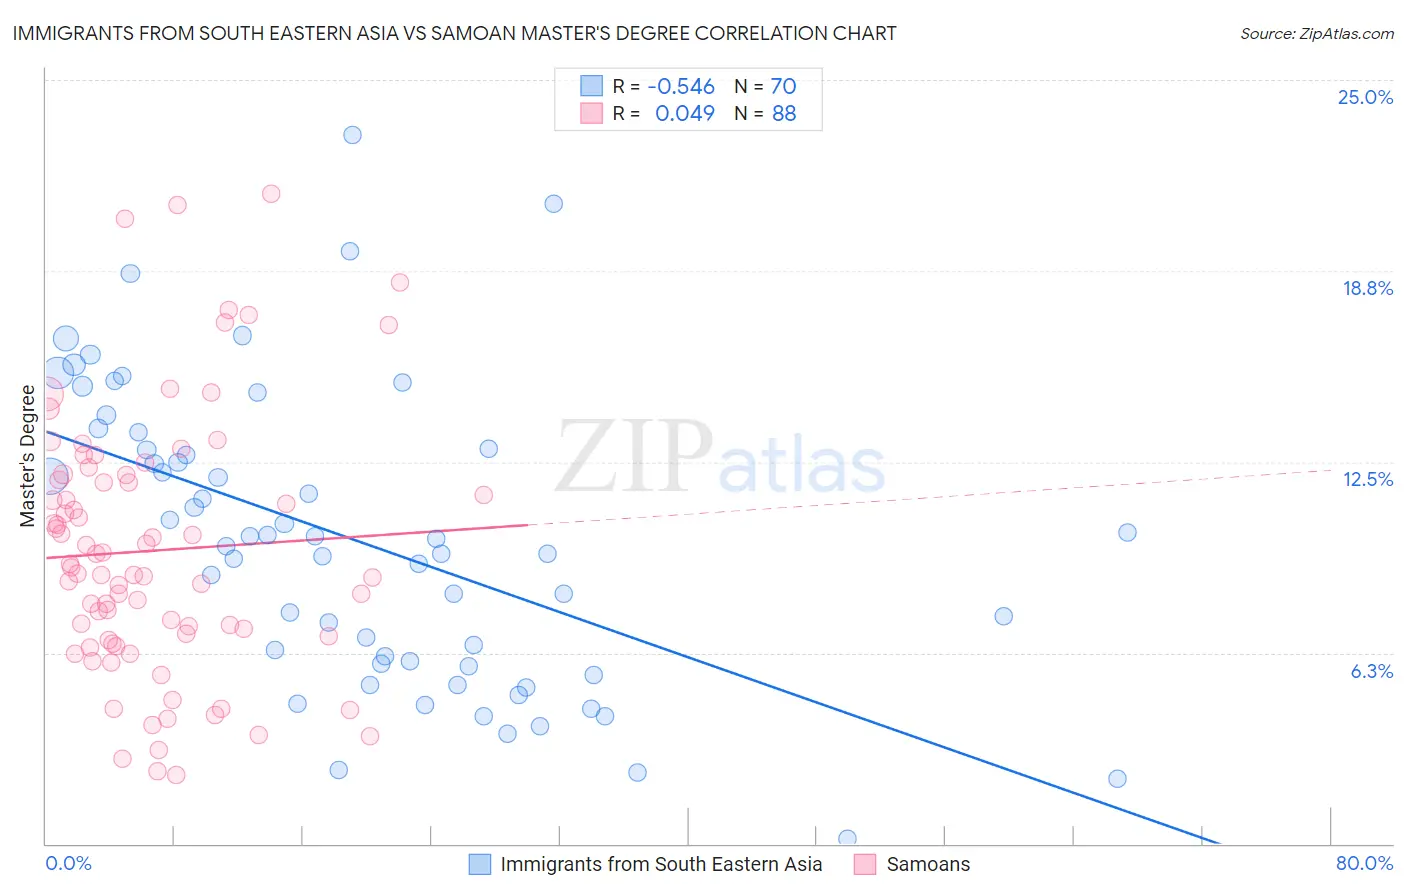
Immigrants from South Eastern Asia vs Samoan Master's Degree Correlation Chart
The statistical analysis conducted on geographies consisting of 512,403,638 people shows a substantial negative correlation between the proportion of Immigrants from South Eastern Asia and percentage of population with at least master's degree education in the United States with a correlation coefficient (R) of -0.546 and weighted average of 14.0%. Similarly, the statistical analysis conducted on geographies consisting of 225,135,673 people shows no correlation between the proportion of Samoans and percentage of population with at least master's degree education in the United States with a correlation coefficient (R) of 0.049 and weighted average of 11.5%, a difference of 21.7%.
Master's Degree Correlation Summary
| Measurement | Immigrants from South Eastern Asia | Samoan |
| Minimum | 0.15% | 2.3% |
| Maximum | 23.2% | 21.3% |
| Range | 23.0% | 19.0% |
| Mean | 9.9% | 9.6% |
| Median | 9.9% | 8.9% |
| Interquartile 25% (IQ1) | 5.9% | 6.7% |
| Interquartile 75% (IQ3) | 12.9% | 12.0% |
| Interquartile Range (IQR) | 7.1% | 5.3% |
| Standard Deviation (Sample) | 4.9% | 4.2% |
| Standard Deviation (Population) | 4.8% | 4.2% |
Similar Demographics by Master's Degree
Demographics Similar to Immigrants from South Eastern Asia by Master's Degree
In terms of master's degree, the demographic groups most similar to Immigrants from South Eastern Asia are Immigrants from Grenada (14.0%, a difference of 0.050%), Ecuadorian (14.0%, a difference of 0.20%), Korean (14.0%, a difference of 0.23%), Portuguese (13.9%, a difference of 0.26%), and Immigrants from St. Vincent and the Grenadines (13.9%, a difference of 0.31%).
| Demographics | Rating | Rank | Master's Degree |
| Immigrants | Somalia | 15.8 /100 | #216 | Poor 14.1% |
| Immigrants | Trinidad and Tobago | 15.8 /100 | #217 | Poor 14.1% |
| French Canadians | 14.9 /100 | #218 | Poor 14.1% |
| Norwegians | 13.6 /100 | #219 | Poor 14.0% |
| Germans | 13.1 /100 | #220 | Poor 14.0% |
| Koreans | 12.7 /100 | #221 | Poor 14.0% |
| Ecuadorians | 12.6 /100 | #222 | Poor 14.0% |
| Immigrants | South Eastern Asia | 11.9 /100 | #223 | Poor 14.0% |
| Immigrants | Grenada | 11.8 /100 | #224 | Poor 14.0% |
| Portuguese | 11.2 /100 | #225 | Poor 13.9% |
| Immigrants | St. Vincent and the Grenadines | 11.0 /100 | #226 | Poor 13.9% |
| Immigrants | West Indies | 9.8 /100 | #227 | Tragic 13.9% |
| Whites/Caucasians | 9.1 /100 | #228 | Tragic 13.8% |
| British West Indians | 8.8 /100 | #229 | Tragic 13.8% |
| Dutch | 8.7 /100 | #230 | Tragic 13.8% |
Demographics Similar to Samoans by Master's Degree
In terms of master's degree, the demographic groups most similar to Samoans are Chickasaw (11.4%, a difference of 0.46%), Chippewa (11.4%, a difference of 0.48%), Tsimshian (11.4%, a difference of 0.64%), Immigrants from Yemen (11.6%, a difference of 0.71%), and Marshallese (11.6%, a difference of 0.84%).
| Demographics | Rating | Rank | Master's Degree |
| Colville | 0.1 /100 | #291 | Tragic 11.6% |
| Immigrants | Guatemala | 0.1 /100 | #292 | Tragic 11.6% |
| Alaska Natives | 0.1 /100 | #293 | Tragic 11.6% |
| Hawaiians | 0.1 /100 | #294 | Tragic 11.6% |
| Marshallese | 0.1 /100 | #295 | Tragic 11.6% |
| Alaskan Athabascans | 0.1 /100 | #296 | Tragic 11.6% |
| Immigrants | Yemen | 0.1 /100 | #297 | Tragic 11.6% |
| Samoans | 0.1 /100 | #298 | Tragic 11.5% |
| Chickasaw | 0.1 /100 | #299 | Tragic 11.4% |
| Chippewa | 0.1 /100 | #300 | Tragic 11.4% |
| Tsimshian | 0.1 /100 | #301 | Tragic 11.4% |
| Cherokee | 0.1 /100 | #302 | Tragic 11.4% |
| Immigrants | Laos | 0.1 /100 | #303 | Tragic 11.4% |
| Immigrants | Cabo Verde | 0.1 /100 | #304 | Tragic 11.3% |
| Immigrants | Latin America | 0.0 /100 | #305 | Tragic 11.3% |