Puget Sound Salish vs Immigrants from Austria Kindergarten
COMPARE
Puget Sound Salish
Immigrants from Austria
Kindergarten
Kindergarten Comparison
Puget Sound Salish
Immigrants from Austria
98.2%
KINDERGARTEN
98.1/ 100
METRIC RATING
100th/ 347
METRIC RANK
98.4%
KINDERGARTEN
99.6/ 100
METRIC RATING
69th/ 347
METRIC RANK
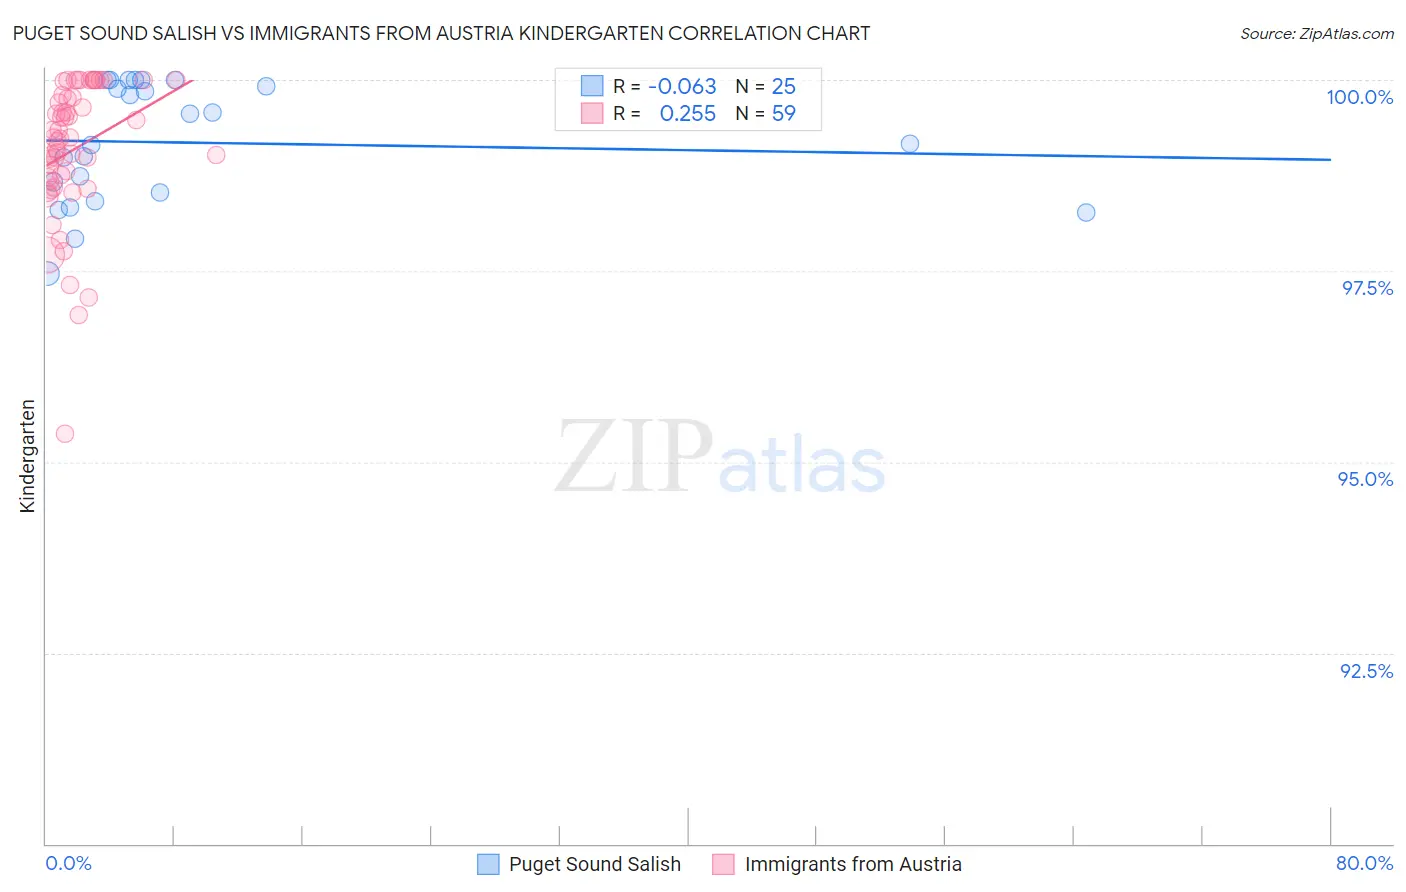
Puget Sound Salish vs Immigrants from Austria Kindergarten Correlation Chart
The statistical analysis conducted on geographies consisting of 46,155,746 people shows a slight negative correlation between the proportion of Puget Sound Salish and percentage of population with at least kindergarten education in the United States with a correlation coefficient (R) of -0.063 and weighted average of 98.2%. Similarly, the statistical analysis conducted on geographies consisting of 167,973,800 people shows a weak positive correlation between the proportion of Immigrants from Austria and percentage of population with at least kindergarten education in the United States with a correlation coefficient (R) of 0.255 and weighted average of 98.4%, a difference of 0.12%.
Kindergarten Correlation Summary
| Measurement | Puget Sound Salish | Immigrants from Austria |
| Minimum | 97.5% | 95.4% |
| Maximum | 100.0% | 100.0% |
| Range | 2.5% | 4.6% |
| Mean | 99.2% | 99.1% |
| Median | 99.2% | 99.2% |
| Interquartile 25% (IQ1) | 98.5% | 98.7% |
| Interquartile 75% (IQ3) | 100.0% | 99.8% |
| Interquartile Range (IQR) | 1.5% | 1.1% |
| Standard Deviation (Sample) | 0.78% | 0.92% |
| Standard Deviation (Population) | 0.76% | 0.91% |
Similar Demographics by Kindergarten
Demographics Similar to Puget Sound Salish by Kindergarten
In terms of kindergarten, the demographic groups most similar to Puget Sound Salish are Nonimmigrants (98.3%, a difference of 0.010%), Cypriot (98.3%, a difference of 0.010%), Choctaw (98.3%, a difference of 0.010%), Colville (98.3%, a difference of 0.010%), and Romanian (98.2%, a difference of 0.010%).
| Demographics | Rating | Rank | Kindergarten |
| Immigrants | India | 98.6 /100 | #93 | Exceptional 98.3% |
| South Africans | 98.5 /100 | #94 | Exceptional 98.3% |
| Immigrants | Germany | 98.5 /100 | #95 | Exceptional 98.3% |
| Immigrants | Nonimmigrants | 98.3 /100 | #96 | Exceptional 98.3% |
| Cypriots | 98.3 /100 | #97 | Exceptional 98.3% |
| Choctaw | 98.2 /100 | #98 | Exceptional 98.3% |
| Colville | 98.2 /100 | #99 | Exceptional 98.3% |
| Puget Sound Salish | 98.1 /100 | #100 | Exceptional 98.2% |
| Romanians | 97.8 /100 | #101 | Exceptional 98.2% |
| Cree | 97.7 /100 | #102 | Exceptional 98.2% |
| Immigrants | Ireland | 97.6 /100 | #103 | Exceptional 98.2% |
| Bhutanese | 97.3 /100 | #104 | Exceptional 98.2% |
| Pima | 97.3 /100 | #105 | Exceptional 98.2% |
| Basques | 97.3 /100 | #106 | Exceptional 98.2% |
| Turks | 97.3 /100 | #107 | Exceptional 98.2% |
Demographics Similar to Immigrants from Austria by Kindergarten
In terms of kindergarten, the demographic groups most similar to Immigrants from Austria are Canadian (98.4%, a difference of 0.0%), Immigrants from Northern Europe (98.4%, a difference of 0.0%), Russian (98.4%, a difference of 0.0%), Chickasaw (98.4%, a difference of 0.0%), and Serbian (98.4%, a difference of 0.0%).
| Demographics | Rating | Rank | Kindergarten |
| New Zealanders | 99.7 /100 | #62 | Exceptional 98.4% |
| Immigrants | North America | 99.7 /100 | #63 | Exceptional 98.4% |
| Greeks | 99.7 /100 | #64 | Exceptional 98.4% |
| Maltese | 99.7 /100 | #65 | Exceptional 98.4% |
| Cheyenne | 99.6 /100 | #66 | Exceptional 98.4% |
| Canadians | 99.6 /100 | #67 | Exceptional 98.4% |
| Immigrants | Northern Europe | 99.6 /100 | #68 | Exceptional 98.4% |
| Immigrants | Austria | 99.6 /100 | #69 | Exceptional 98.4% |
| Russians | 99.6 /100 | #70 | Exceptional 98.4% |
| Chickasaw | 99.6 /100 | #71 | Exceptional 98.4% |
| Serbians | 99.6 /100 | #72 | Exceptional 98.4% |
| Cajuns | 99.4 /100 | #73 | Exceptional 98.3% |
| Immigrants | Netherlands | 99.3 /100 | #74 | Exceptional 98.3% |
| Cherokee | 99.3 /100 | #75 | Exceptional 98.3% |
| Immigrants | England | 99.3 /100 | #76 | Exceptional 98.3% |