Estonian vs Immigrants from Austria Kindergarten
COMPARE
Estonian
Immigrants from Austria
Kindergarten
Kindergarten Comparison
Estonians
Immigrants from Austria
98.4%
KINDERGARTEN
99.8/ 100
METRIC RATING
51st/ 347
METRIC RANK
98.4%
KINDERGARTEN
99.6/ 100
METRIC RATING
69th/ 347
METRIC RANK
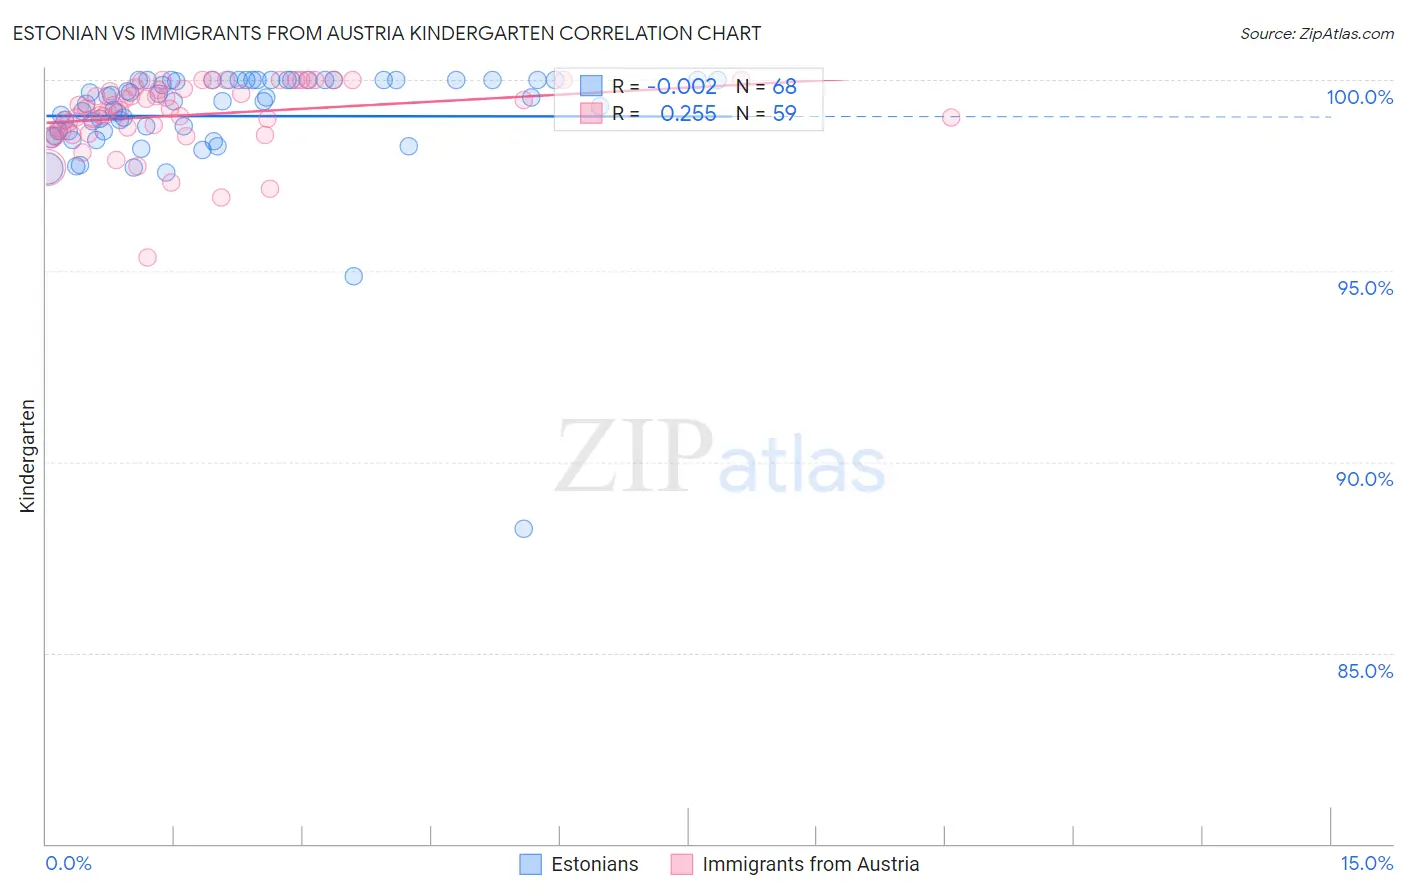
Estonian vs Immigrants from Austria Kindergarten Correlation Chart
The statistical analysis conducted on geographies consisting of 123,528,404 people shows no correlation between the proportion of Estonians and percentage of population with at least kindergarten education in the United States with a correlation coefficient (R) of -0.002 and weighted average of 98.4%. Similarly, the statistical analysis conducted on geographies consisting of 167,973,800 people shows a weak positive correlation between the proportion of Immigrants from Austria and percentage of population with at least kindergarten education in the United States with a correlation coefficient (R) of 0.255 and weighted average of 98.4%, a difference of 0.060%.
Kindergarten Correlation Summary
| Measurement | Estonian | Immigrants from Austria |
| Minimum | 88.3% | 95.4% |
| Maximum | 100.0% | 100.0% |
| Range | 11.7% | 4.6% |
| Mean | 99.1% | 99.1% |
| Median | 99.4% | 99.2% |
| Interquartile 25% (IQ1) | 98.7% | 98.7% |
| Interquartile 75% (IQ3) | 100.0% | 99.8% |
| Interquartile Range (IQR) | 1.3% | 1.1% |
| Standard Deviation (Sample) | 1.6% | 0.92% |
| Standard Deviation (Population) | 1.6% | 0.91% |
Demographics Similar to Estonians and Immigrants from Austria by Kindergarten
In terms of kindergarten, the demographic groups most similar to Estonians are White/Caucasian (98.4%, a difference of 0.0%), Australian (98.4%, a difference of 0.0%), Celtic (98.4%, a difference of 0.0%), Pueblo (98.4%, a difference of 0.0%), and Immigrants from Scotland (98.4%, a difference of 0.010%). Similarly, the demographic groups most similar to Immigrants from Austria are Canadian (98.4%, a difference of 0.0%), Immigrants from Northern Europe (98.4%, a difference of 0.0%), Russian (98.4%, a difference of 0.0%), Cheyenne (98.4%, a difference of 0.010%), and Immigrants from North America (98.4%, a difference of 0.020%).
| Demographics | Rating | Rank | Kindergarten |
| Whites/Caucasians | 99.8 /100 | #50 | Exceptional 98.4% |
| Estonians | 99.8 /100 | #51 | Exceptional 98.4% |
| Australians | 99.8 /100 | #52 | Exceptional 98.4% |
| Celtics | 99.8 /100 | #53 | Exceptional 98.4% |
| Pueblo | 99.8 /100 | #54 | Exceptional 98.4% |
| Immigrants | Scotland | 99.8 /100 | #55 | Exceptional 98.4% |
| Americans | 99.8 /100 | #56 | Exceptional 98.4% |
| Austrians | 99.8 /100 | #57 | Exceptional 98.4% |
| Bulgarians | 99.7 /100 | #58 | Exceptional 98.4% |
| Immigrants | Canada | 99.7 /100 | #59 | Exceptional 98.4% |
| Creek | 99.7 /100 | #60 | Exceptional 98.4% |
| Slavs | 99.7 /100 | #61 | Exceptional 98.4% |
| New Zealanders | 99.7 /100 | #62 | Exceptional 98.4% |
| Immigrants | North America | 99.7 /100 | #63 | Exceptional 98.4% |
| Greeks | 99.7 /100 | #64 | Exceptional 98.4% |
| Maltese | 99.7 /100 | #65 | Exceptional 98.4% |
| Cheyenne | 99.6 /100 | #66 | Exceptional 98.4% |
| Canadians | 99.6 /100 | #67 | Exceptional 98.4% |
| Immigrants | Northern Europe | 99.6 /100 | #68 | Exceptional 98.4% |
| Immigrants | Austria | 99.6 /100 | #69 | Exceptional 98.4% |
| Russians | 99.6 /100 | #70 | Exceptional 98.4% |