Guatemalan vs Lithuanian 10th Grade
COMPARE
Guatemalan
Lithuanian
10th Grade
10th Grade Comparison
Guatemalans
Lithuanians
87.9%
10TH GRADE
0.0/ 100
METRIC RATING
339th/ 347
METRIC RANK
95.8%
10TH GRADE
100.0/ 100
METRIC RATING
8th/ 347
METRIC RANK
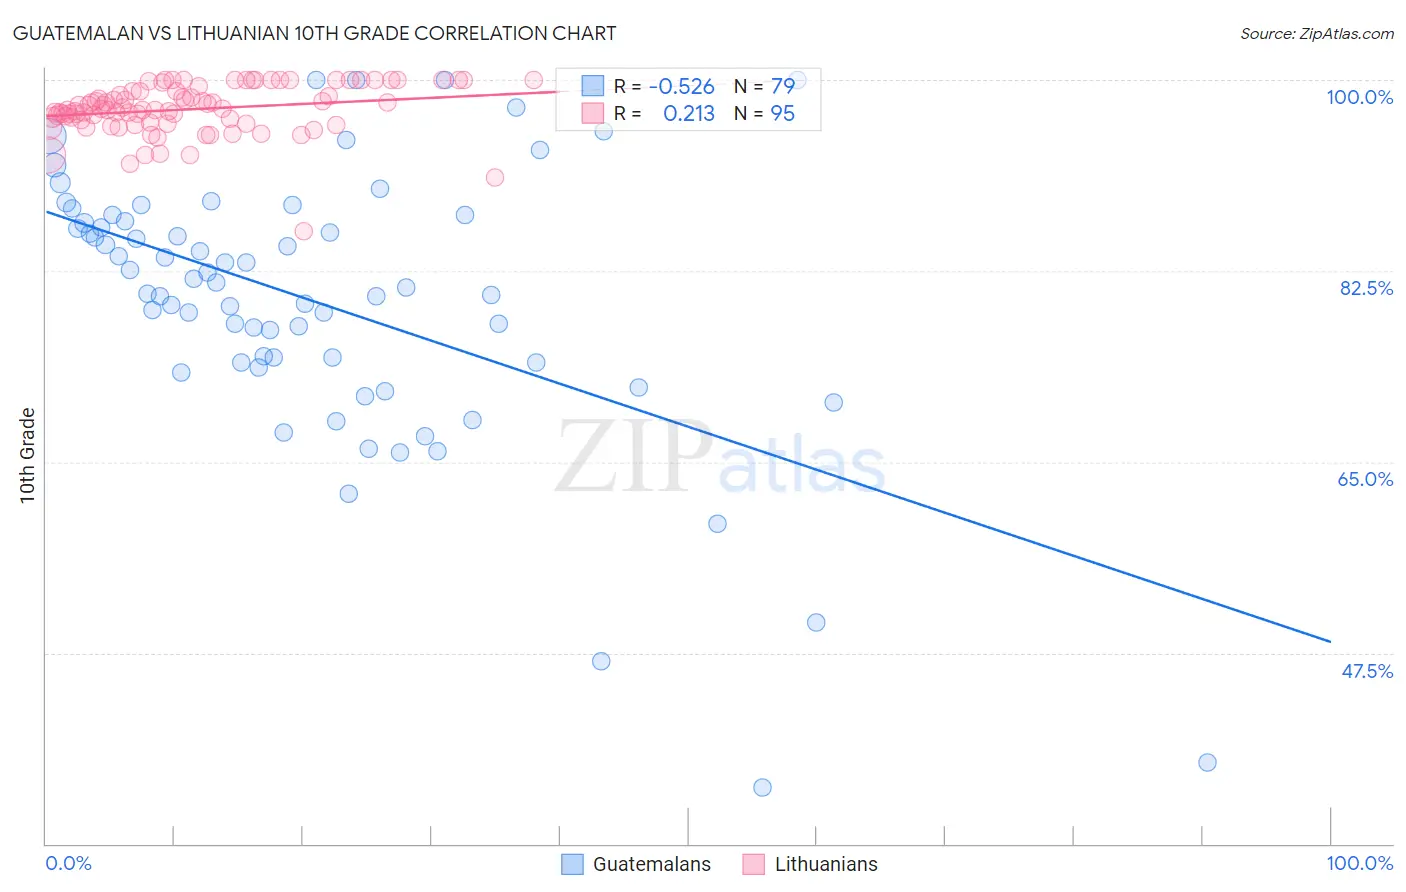
Guatemalan vs Lithuanian 10th Grade Correlation Chart
The statistical analysis conducted on geographies consisting of 409,566,618 people shows a substantial negative correlation between the proportion of Guatemalans and percentage of population with at least 10th grade education in the United States with a correlation coefficient (R) of -0.526 and weighted average of 87.9%. Similarly, the statistical analysis conducted on geographies consisting of 421,947,524 people shows a weak positive correlation between the proportion of Lithuanians and percentage of population with at least 10th grade education in the United States with a correlation coefficient (R) of 0.213 and weighted average of 95.8%, a difference of 9.0%.
10th Grade Correlation Summary
| Measurement | Guatemalan | Lithuanian |
| Minimum | 35.2% | 86.1% |
| Maximum | 100.0% | 100.0% |
| Range | 64.8% | 13.9% |
| Mean | 79.6% | 97.3% |
| Median | 81.0% | 97.4% |
| Interquartile 25% (IQ1) | 74.1% | 96.1% |
| Interquartile 75% (IQ3) | 87.0% | 99.0% |
| Interquartile Range (IQR) | 12.9% | 2.9% |
| Standard Deviation (Sample) | 12.6% | 2.3% |
| Standard Deviation (Population) | 12.5% | 2.3% |
Similar Demographics by 10th Grade
Demographics Similar to Guatemalans by 10th Grade
In terms of 10th grade, the demographic groups most similar to Guatemalans are Mexican (87.8%, a difference of 0.16%), Salvadoran (87.5%, a difference of 0.44%), Immigrants from Latin America (88.3%, a difference of 0.49%), Central American (88.4%, a difference of 0.56%), and Immigrants from Guatemala (87.4%, a difference of 0.60%).
| Demographics | Rating | Rank | 10th Grade |
| Immigrants | Azores | 0.0 /100 | #332 | Tragic 89.0% |
| Hondurans | 0.0 /100 | #333 | Tragic 89.0% |
| Hispanics or Latinos | 0.0 /100 | #334 | Tragic 88.9% |
| Immigrants | Dominican Republic | 0.0 /100 | #335 | Tragic 88.7% |
| Immigrants | Honduras | 0.0 /100 | #336 | Tragic 88.5% |
| Central Americans | 0.0 /100 | #337 | Tragic 88.4% |
| Immigrants | Latin America | 0.0 /100 | #338 | Tragic 88.3% |
| Guatemalans | 0.0 /100 | #339 | Tragic 87.9% |
| Mexicans | 0.0 /100 | #340 | Tragic 87.8% |
| Salvadorans | 0.0 /100 | #341 | Tragic 87.5% |
| Immigrants | Guatemala | 0.0 /100 | #342 | Tragic 87.4% |
| Yakama | 0.0 /100 | #343 | Tragic 86.9% |
| Immigrants | El Salvador | 0.0 /100 | #344 | Tragic 86.8% |
| Immigrants | Central America | 0.0 /100 | #345 | Tragic 86.6% |
| Spanish American Indians | 0.0 /100 | #346 | Tragic 86.2% |
Demographics Similar to Lithuanians by 10th Grade
In terms of 10th grade, the demographic groups most similar to Lithuanians are German (95.8%, a difference of 0.010%), Polish (95.8%, a difference of 0.030%), Finnish (95.8%, a difference of 0.060%), Croatian (95.7%, a difference of 0.080%), and Danish (95.7%, a difference of 0.11%).
| Demographics | Rating | Rank | 10th Grade |
| Norwegians | 100.0 /100 | #1 | Exceptional 96.2% |
| Slovaks | 100.0 /100 | #2 | Exceptional 96.0% |
| Slovenes | 100.0 /100 | #3 | Exceptional 95.9% |
| Swedes | 100.0 /100 | #4 | Exceptional 95.9% |
| Carpatho Rusyns | 100.0 /100 | #5 | Exceptional 95.9% |
| Poles | 100.0 /100 | #6 | Exceptional 95.8% |
| Germans | 100.0 /100 | #7 | Exceptional 95.8% |
| Lithuanians | 100.0 /100 | #8 | Exceptional 95.8% |
| Finns | 100.0 /100 | #9 | Exceptional 95.8% |
| Croatians | 100.0 /100 | #10 | Exceptional 95.7% |
| Danes | 100.0 /100 | #11 | Exceptional 95.7% |
| Tlingit-Haida | 100.0 /100 | #12 | Exceptional 95.7% |
| English | 100.0 /100 | #13 | Exceptional 95.6% |
| Tsimshian | 100.0 /100 | #14 | Exceptional 95.6% |
| Irish | 100.0 /100 | #15 | Exceptional 95.6% |