Immigrants from Asia vs Argentinean 4th Grade
COMPARE
Immigrants from Asia
Argentinean
4th Grade
4th Grade Comparison
Immigrants from Asia
Argentineans
97.1%
4TH GRADE
1.2/ 100
METRIC RATING
248th/ 347
METRIC RANK
97.5%
4TH GRADE
39.0/ 100
METRIC RATING
183rd/ 347
METRIC RANK
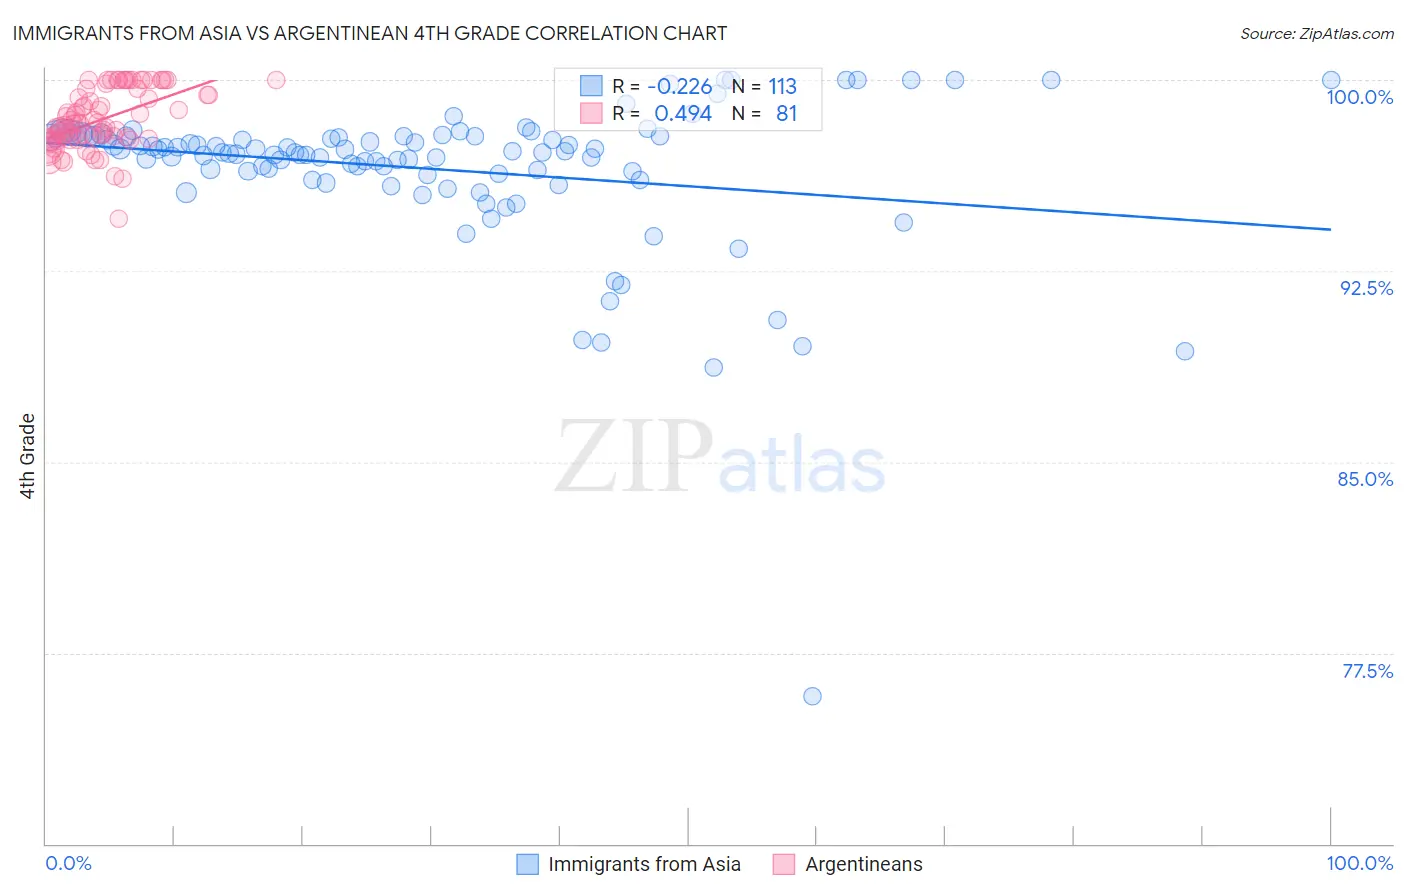
Immigrants from Asia vs Argentinean 4th Grade Correlation Chart
The statistical analysis conducted on geographies consisting of 549,170,438 people shows a weak negative correlation between the proportion of Immigrants from Asia and percentage of population with at least 4th grade education in the United States with a correlation coefficient (R) of -0.226 and weighted average of 97.1%. Similarly, the statistical analysis conducted on geographies consisting of 297,143,222 people shows a moderate positive correlation between the proportion of Argentineans and percentage of population with at least 4th grade education in the United States with a correlation coefficient (R) of 0.494 and weighted average of 97.5%, a difference of 0.38%.
4th Grade Correlation Summary
| Measurement | Immigrants from Asia | Argentinean |
| Minimum | 75.8% | 94.5% |
| Maximum | 100.0% | 100.0% |
| Range | 24.2% | 5.5% |
| Mean | 96.5% | 98.5% |
| Median | 97.2% | 98.3% |
| Interquartile 25% (IQ1) | 96.3% | 97.7% |
| Interquartile 75% (IQ3) | 97.8% | 99.7% |
| Interquartile Range (IQR) | 1.5% | 2.0% |
| Standard Deviation (Sample) | 3.0% | 1.2% |
| Standard Deviation (Population) | 3.0% | 1.2% |
Similar Demographics by 4th Grade
Demographics Similar to Immigrants from Asia by 4th Grade
In terms of 4th grade, the demographic groups most similar to Immigrants from Asia are Immigrants from Uruguay (97.1%, a difference of 0.0%), Ethiopian (97.1%, a difference of 0.0%), U.S. Virgin Islander (97.1%, a difference of 0.010%), Korean (97.1%, a difference of 0.010%), and Immigrants from Eastern Africa (97.1%, a difference of 0.010%).
| Demographics | Rating | Rank | 4th Grade |
| Immigrants | Indonesia | 1.5 /100 | #241 | Tragic 97.1% |
| Asians | 1.4 /100 | #242 | Tragic 97.1% |
| U.S. Virgin Islanders | 1.4 /100 | #243 | Tragic 97.1% |
| Koreans | 1.3 /100 | #244 | Tragic 97.1% |
| Immigrants | Eastern Africa | 1.2 /100 | #245 | Tragic 97.1% |
| Immigrants | Uruguay | 1.2 /100 | #246 | Tragic 97.1% |
| Ethiopians | 1.2 /100 | #247 | Tragic 97.1% |
| Immigrants | Asia | 1.2 /100 | #248 | Tragic 97.1% |
| Immigrants | Africa | 1.0 /100 | #249 | Tragic 97.1% |
| Immigrants | Senegal | 0.9 /100 | #250 | Tragic 97.1% |
| South Americans | 0.8 /100 | #251 | Tragic 97.1% |
| Jamaicans | 0.8 /100 | #252 | Tragic 97.1% |
| Immigrants | Liberia | 0.8 /100 | #253 | Tragic 97.1% |
| Immigrants | Middle Africa | 0.8 /100 | #254 | Tragic 97.1% |
| Peruvians | 0.7 /100 | #255 | Tragic 97.1% |
Demographics Similar to Argentineans by 4th Grade
In terms of 4th grade, the demographic groups most similar to Argentineans are Spanish American (97.5%, a difference of 0.0%), Immigrants from Venezuela (97.5%, a difference of 0.010%), Immigrants from Taiwan (97.5%, a difference of 0.010%), Pakistani (97.5%, a difference of 0.010%), and Immigrants from Kenya (97.5%, a difference of 0.010%).
| Demographics | Rating | Rank | 4th Grade |
| Arabs | 48.7 /100 | #176 | Average 97.5% |
| Immigrants | Brazil | 46.1 /100 | #177 | Average 97.5% |
| Comanche | 45.3 /100 | #178 | Average 97.5% |
| Immigrants | Kazakhstan | 43.6 /100 | #179 | Average 97.5% |
| Immigrants | Venezuela | 42.7 /100 | #180 | Average 97.5% |
| Immigrants | Taiwan | 41.5 /100 | #181 | Average 97.5% |
| Spanish Americans | 39.3 /100 | #182 | Fair 97.5% |
| Argentineans | 39.0 /100 | #183 | Fair 97.5% |
| Pakistanis | 36.2 /100 | #184 | Fair 97.5% |
| Immigrants | Kenya | 35.8 /100 | #185 | Fair 97.5% |
| Dutch West Indians | 35.8 /100 | #186 | Fair 97.5% |
| Mongolians | 34.7 /100 | #187 | Fair 97.5% |
| Immigrants | Argentina | 34.6 /100 | #188 | Fair 97.5% |
| Panamanians | 31.9 /100 | #189 | Fair 97.4% |
| Blacks/African Americans | 31.1 /100 | #190 | Fair 97.4% |