Immigrants from Middle Africa vs Subsaharan African 2nd Grade
COMPARE
Immigrants from Middle Africa
Subsaharan African
2nd Grade
2nd Grade Comparison
Immigrants from Middle Africa
Sub-Saharan Africans
97.5%
2ND GRADE
0.9/ 100
METRIC RATING
248th/ 347
METRIC RANK
97.6%
2ND GRADE
3.4/ 100
METRIC RATING
228th/ 347
METRIC RANK
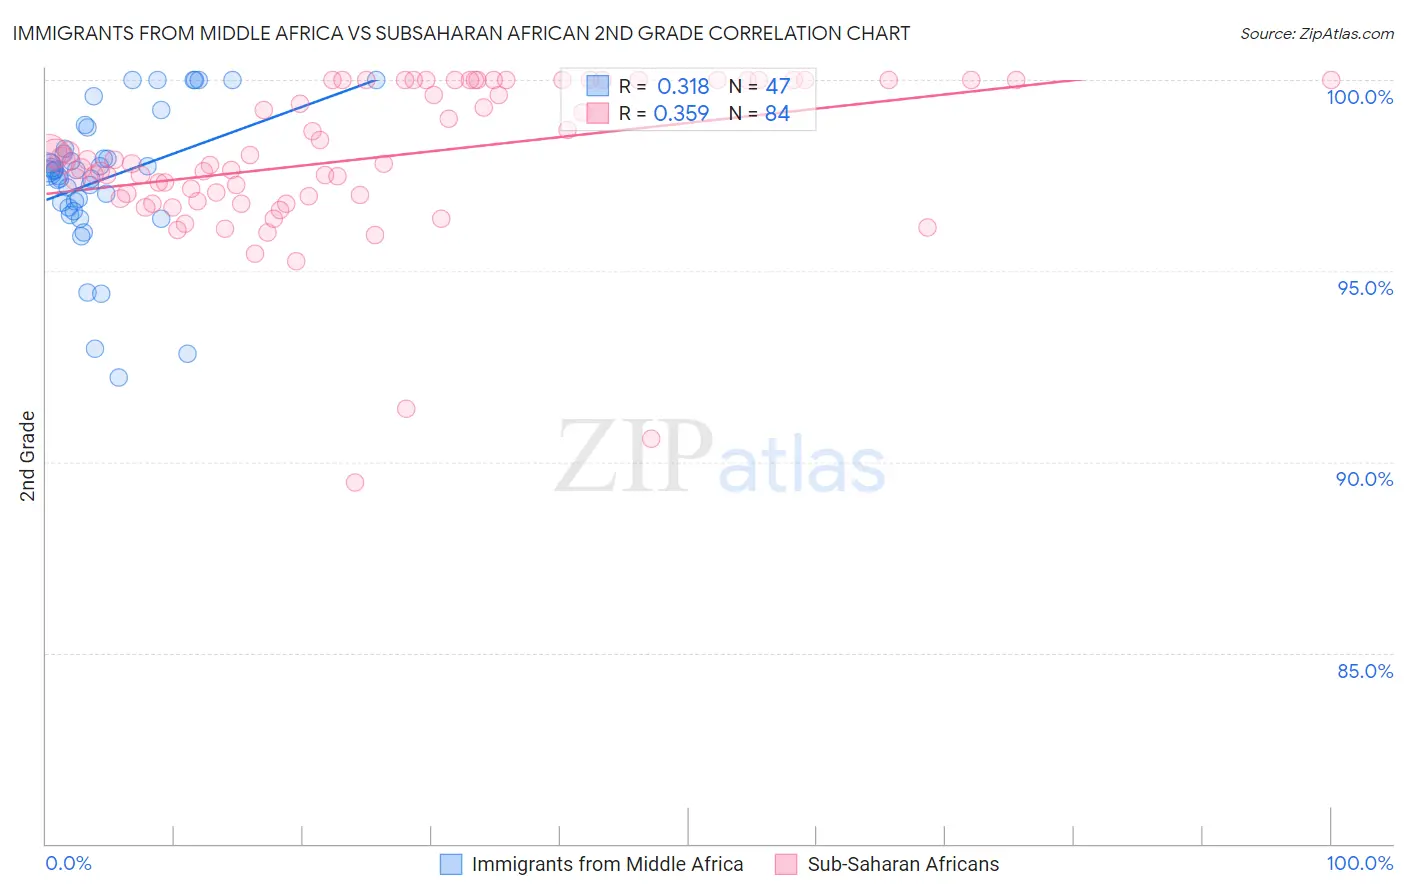
Immigrants from Middle Africa vs Subsaharan African 2nd Grade Correlation Chart
The statistical analysis conducted on geographies consisting of 202,721,852 people shows a mild positive correlation between the proportion of Immigrants from Middle Africa and percentage of population with at least 2nd grade education in the United States with a correlation coefficient (R) of 0.318 and weighted average of 97.5%. Similarly, the statistical analysis conducted on geographies consisting of 508,209,936 people shows a mild positive correlation between the proportion of Sub-Saharan Africans and percentage of population with at least 2nd grade education in the United States with a correlation coefficient (R) of 0.359 and weighted average of 97.6%, a difference of 0.11%.
2nd Grade Correlation Summary
| Measurement | Immigrants from Middle Africa | Subsaharan African |
| Minimum | 92.2% | 89.5% |
| Maximum | 100.0% | 100.0% |
| Range | 7.8% | 10.5% |
| Mean | 97.4% | 98.0% |
| Median | 97.6% | 97.9% |
| Interquartile 25% (IQ1) | 96.7% | 96.9% |
| Interquartile 75% (IQ3) | 98.2% | 100.0% |
| Interquartile Range (IQR) | 1.6% | 3.1% |
| Standard Deviation (Sample) | 1.8% | 2.0% |
| Standard Deviation (Population) | 1.8% | 2.0% |
Demographics Similar to Immigrants from Middle Africa and Sub-Saharan Africans by 2nd Grade
In terms of 2nd grade, the demographic groups most similar to Immigrants from Middle Africa are Immigrants from Eastern Africa (97.5%, a difference of 0.0%), South American (97.5%, a difference of 0.0%), Immigrants from Senegal (97.5%, a difference of 0.0%), Immigrants from Iraq (97.5%, a difference of 0.010%), and Ethiopian (97.5%, a difference of 0.020%). Similarly, the demographic groups most similar to Sub-Saharan Africans are Immigrants from Costa Rica (97.6%, a difference of 0.010%), Senegalese (97.6%, a difference of 0.010%), Immigrants from Pakistan (97.6%, a difference of 0.030%), Immigrants from Western Asia (97.6%, a difference of 0.040%), and Immigrants from Uruguay (97.6%, a difference of 0.040%).
| Demographics | Rating | Rank | 2nd Grade |
| Sub-Saharan Africans | 3.4 /100 | #228 | Tragic 97.6% |
| Immigrants | Costa Rica | 3.1 /100 | #229 | Tragic 97.6% |
| Senegalese | 3.1 /100 | #230 | Tragic 97.6% |
| Immigrants | Pakistan | 2.3 /100 | #231 | Tragic 97.6% |
| Immigrants | Western Asia | 2.1 /100 | #232 | Tragic 97.6% |
| Immigrants | Uruguay | 2.1 /100 | #233 | Tragic 97.6% |
| Immigrants | Malaysia | 2.0 /100 | #234 | Tragic 97.6% |
| Colombians | 1.9 /100 | #235 | Tragic 97.6% |
| Nigerians | 1.7 /100 | #236 | Tragic 97.6% |
| U.S. Virgin Islanders | 1.6 /100 | #237 | Tragic 97.6% |
| Immigrants | Eastern Asia | 1.6 /100 | #238 | Tragic 97.6% |
| Liberians | 1.6 /100 | #239 | Tragic 97.6% |
| Koreans | 1.5 /100 | #240 | Tragic 97.5% |
| Ethiopians | 1.2 /100 | #241 | Tragic 97.5% |
| Immigrants | Indonesia | 1.2 /100 | #242 | Tragic 97.5% |
| Asians | 1.1 /100 | #243 | Tragic 97.5% |
| Immigrants | Iraq | 1.0 /100 | #244 | Tragic 97.5% |
| Immigrants | Eastern Africa | 0.9 /100 | #245 | Tragic 97.5% |
| South Americans | 0.9 /100 | #246 | Tragic 97.5% |
| Immigrants | Senegal | 0.9 /100 | #247 | Tragic 97.5% |
| Immigrants | Middle Africa | 0.9 /100 | #248 | Tragic 97.5% |