Immigrants from Cameroon vs Immigrants from Lebanon 1st Grade
COMPARE
Immigrants from Cameroon
Immigrants from Lebanon
1st Grade
1st Grade Comparison
Immigrants from Cameroon
Immigrants from Lebanon
97.4%
1ST GRADE
0.2/ 100
METRIC RATING
271st/ 347
METRIC RANK
97.8%
1ST GRADE
20.1/ 100
METRIC RATING
201st/ 347
METRIC RANK
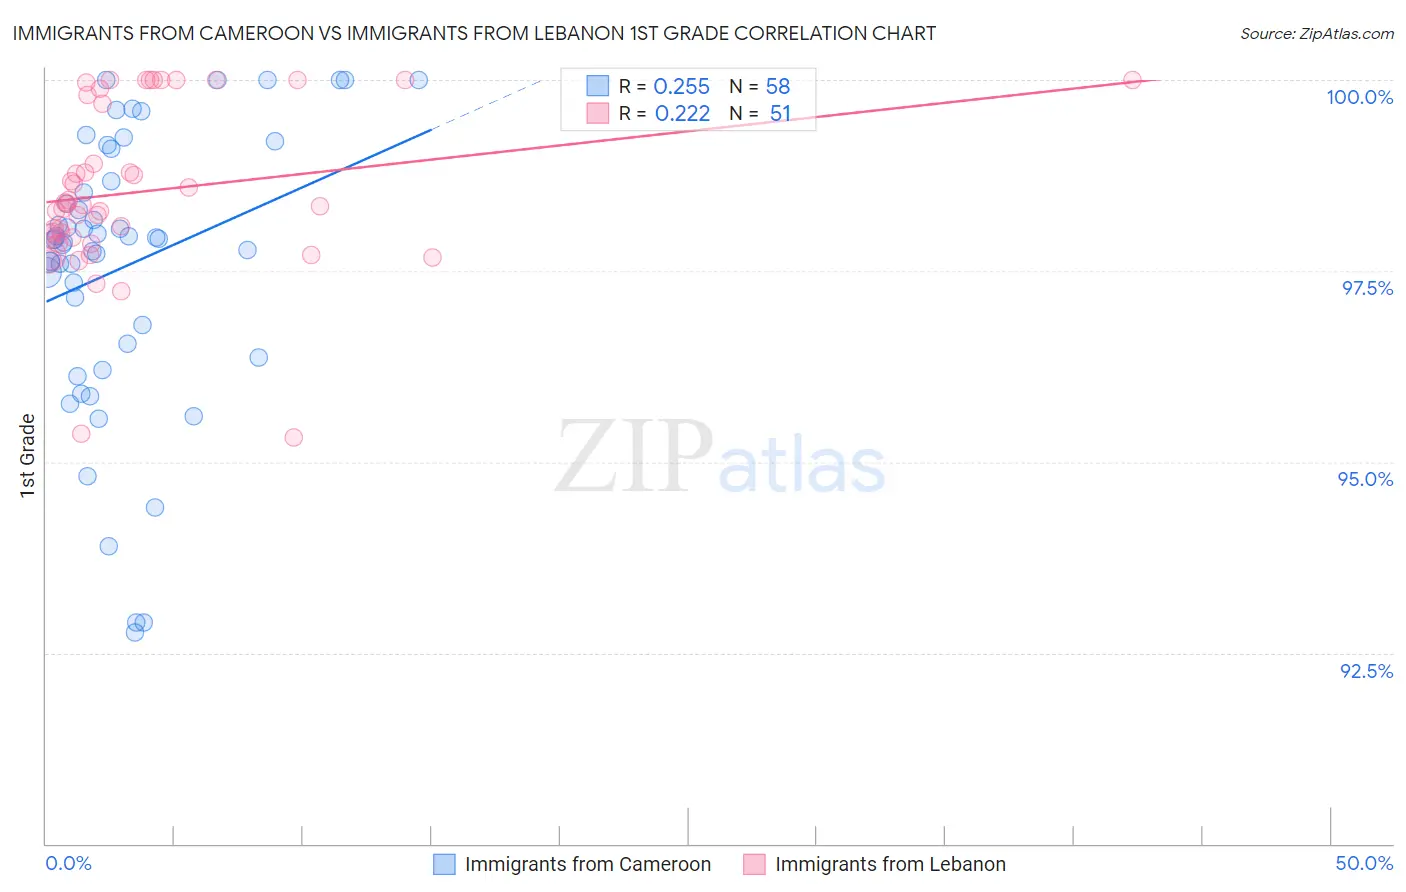
Immigrants from Cameroon vs Immigrants from Lebanon 1st Grade Correlation Chart
The statistical analysis conducted on geographies consisting of 130,752,798 people shows a weak positive correlation between the proportion of Immigrants from Cameroon and percentage of population with at least 1st grade education in the United States with a correlation coefficient (R) of 0.255 and weighted average of 97.4%. Similarly, the statistical analysis conducted on geographies consisting of 217,102,284 people shows a weak positive correlation between the proportion of Immigrants from Lebanon and percentage of population with at least 1st grade education in the United States with a correlation coefficient (R) of 0.222 and weighted average of 97.8%, a difference of 0.38%.
1st Grade Correlation Summary
| Measurement | Immigrants from Cameroon | Immigrants from Lebanon |
| Minimum | 92.8% | 95.3% |
| Maximum | 100.0% | 100.0% |
| Range | 7.2% | 4.7% |
| Mean | 97.6% | 98.5% |
| Median | 97.9% | 98.4% |
| Interquartile 25% (IQ1) | 96.6% | 97.9% |
| Interquartile 75% (IQ3) | 98.7% | 99.8% |
| Interquartile Range (IQR) | 2.1% | 1.9% |
| Standard Deviation (Sample) | 1.8% | 1.1% |
| Standard Deviation (Population) | 1.8% | 1.1% |
Similar Demographics by 1st Grade
Demographics Similar to Immigrants from Cameroon by 1st Grade
In terms of 1st grade, the demographic groups most similar to Immigrants from Cameroon are Immigrants from Peru (97.4%, a difference of 0.0%), Immigrants from Bolivia (97.4%, a difference of 0.0%), Immigrants from Jamaica (97.5%, a difference of 0.020%), West Indian (97.5%, a difference of 0.030%), and Ghanaian (97.4%, a difference of 0.030%).
| Demographics | Rating | Rank | 1st Grade |
| Taiwanese | 0.4 /100 | #264 | Tragic 97.5% |
| Cubans | 0.3 /100 | #265 | Tragic 97.5% |
| Immigrants | Liberia | 0.3 /100 | #266 | Tragic 97.5% |
| Immigrants | Sierra Leone | 0.3 /100 | #267 | Tragic 97.5% |
| Immigrants | Nigeria | 0.3 /100 | #268 | Tragic 97.5% |
| West Indians | 0.3 /100 | #269 | Tragic 97.5% |
| Immigrants | Jamaica | 0.2 /100 | #270 | Tragic 97.5% |
| Immigrants | Cameroon | 0.2 /100 | #271 | Tragic 97.4% |
| Immigrants | Peru | 0.2 /100 | #272 | Tragic 97.4% |
| Immigrants | Bolivia | 0.2 /100 | #273 | Tragic 97.4% |
| Ghanaians | 0.1 /100 | #274 | Tragic 97.4% |
| Immigrants | China | 0.1 /100 | #275 | Tragic 97.4% |
| Immigrants | Philippines | 0.1 /100 | #276 | Tragic 97.4% |
| Immigrants | Western Africa | 0.1 /100 | #277 | Tragic 97.4% |
| Immigrants | Uzbekistan | 0.1 /100 | #278 | Tragic 97.4% |
Demographics Similar to Immigrants from Lebanon by 1st Grade
In terms of 1st grade, the demographic groups most similar to Immigrants from Lebanon are Immigrants from Ukraine (97.8%, a difference of 0.0%), Tohono O'odham (97.8%, a difference of 0.010%), Immigrants from Egypt (97.8%, a difference of 0.010%), Immigrants from Southern Europe (97.8%, a difference of 0.010%), and Immigrants from Uganda (97.8%, a difference of 0.010%).
| Demographics | Rating | Rank | 1st Grade |
| Mongolians | 29.2 /100 | #194 | Fair 97.9% |
| Hawaiians | 28.8 /100 | #195 | Fair 97.9% |
| Immigrants | Kenya | 26.3 /100 | #196 | Fair 97.8% |
| Guamanians/Chamorros | 26.2 /100 | #197 | Fair 97.8% |
| Yuman | 24.4 /100 | #198 | Fair 97.8% |
| Tohono O'odham | 23.2 /100 | #199 | Fair 97.8% |
| Immigrants | Egypt | 22.6 /100 | #200 | Fair 97.8% |
| Immigrants | Lebanon | 20.1 /100 | #201 | Fair 97.8% |
| Immigrants | Ukraine | 19.2 /100 | #202 | Poor 97.8% |
| Immigrants | Southern Europe | 18.2 /100 | #203 | Poor 97.8% |
| Immigrants | Uganda | 18.2 /100 | #204 | Poor 97.8% |
| Immigrants | Chile | 17.7 /100 | #205 | Poor 97.8% |
| Immigrants | Albania | 17.3 /100 | #206 | Poor 97.8% |
| Africans | 16.5 /100 | #207 | Poor 97.8% |
| Immigrants | Northern Africa | 12.0 /100 | #208 | Poor 97.8% |