Guamanian/Chamorro vs Immigrants from Europe 11th Grade
COMPARE
Guamanian/Chamorro
Immigrants from Europe
11th Grade
11th Grade Comparison
Guamanians/Chamorros
Immigrants from Europe
92.5%
11TH GRADE
45.0/ 100
METRIC RATING
177th/ 347
METRIC RANK
93.5%
11TH GRADE
98.6/ 100
METRIC RATING
104th/ 347
METRIC RANK
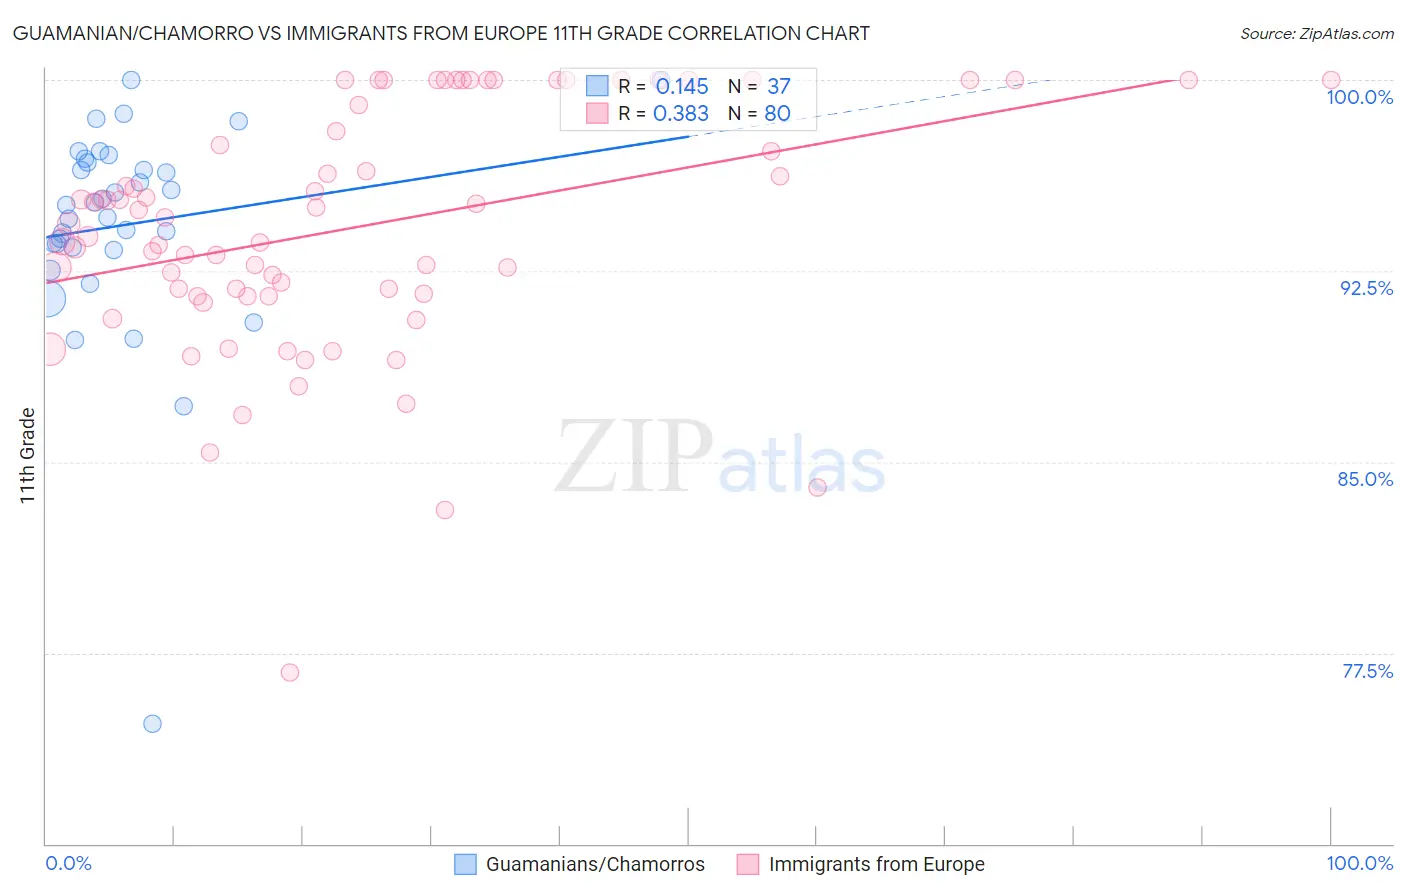
Guamanian/Chamorro vs Immigrants from Europe 11th Grade Correlation Chart
The statistical analysis conducted on geographies consisting of 221,965,618 people shows a poor positive correlation between the proportion of Guamanians/Chamorros and percentage of population with at least 11th grade education in the United States with a correlation coefficient (R) of 0.145 and weighted average of 92.5%. Similarly, the statistical analysis conducted on geographies consisting of 547,425,973 people shows a mild positive correlation between the proportion of Immigrants from Europe and percentage of population with at least 11th grade education in the United States with a correlation coefficient (R) of 0.383 and weighted average of 93.5%, a difference of 1.1%.
11th Grade Correlation Summary
| Measurement | Guamanian/Chamorro | Immigrants from Europe |
| Minimum | 74.7% | 76.7% |
| Maximum | 100.0% | 100.0% |
| Range | 25.3% | 23.3% |
| Mean | 94.3% | 94.2% |
| Median | 95.1% | 94.5% |
| Interquartile 25% (IQ1) | 93.4% | 91.6% |
| Interquartile 75% (IQ3) | 96.8% | 99.5% |
| Interquartile Range (IQR) | 3.5% | 7.9% |
| Standard Deviation (Sample) | 4.4% | 4.8% |
| Standard Deviation (Population) | 4.3% | 4.7% |
Similar Demographics by 11th Grade
Demographics Similar to Guamanians/Chamorros by 11th Grade
In terms of 11th grade, the demographic groups most similar to Guamanians/Chamorros are Spaniard (92.5%, a difference of 0.020%), Sudanese (92.5%, a difference of 0.020%), Shoshone (92.5%, a difference of 0.040%), Creek (92.4%, a difference of 0.040%), and Inupiat (92.4%, a difference of 0.040%).
| Demographics | Rating | Rank | 11th Grade |
| Immigrants | Northern Africa | 57.3 /100 | #170 | Average 92.6% |
| Laotians | 54.4 /100 | #171 | Average 92.6% |
| Immigrants | Pakistan | 52.3 /100 | #172 | Average 92.5% |
| Indians (Asian) | 51.5 /100 | #173 | Average 92.5% |
| Asians | 50.0 /100 | #174 | Average 92.5% |
| Shoshone | 48.9 /100 | #175 | Average 92.5% |
| Spaniards | 46.9 /100 | #176 | Average 92.5% |
| Guamanians/Chamorros | 45.0 /100 | #177 | Average 92.5% |
| Sudanese | 43.4 /100 | #178 | Average 92.5% |
| Creek | 40.9 /100 | #179 | Average 92.4% |
| Inupiat | 40.7 /100 | #180 | Average 92.4% |
| Cherokee | 40.7 /100 | #181 | Average 92.4% |
| Immigrants | Morocco | 38.6 /100 | #182 | Fair 92.4% |
| Immigrants | Malaysia | 37.6 /100 | #183 | Fair 92.4% |
| Immigrants | Asia | 37.4 /100 | #184 | Fair 92.4% |
Demographics Similar to Immigrants from Europe by 11th Grade
In terms of 11th grade, the demographic groups most similar to Immigrants from Europe are Chippewa (93.5%, a difference of 0.0%), Lebanese (93.5%, a difference of 0.0%), Immigrants from Serbia (93.5%, a difference of 0.0%), Immigrants from Croatia (93.5%, a difference of 0.0%), and Immigrants from Romania (93.5%, a difference of 0.010%).
| Demographics | Rating | Rank | 11th Grade |
| Immigrants | Iran | 98.9 /100 | #97 | Exceptional 93.5% |
| Immigrants | Israel | 98.8 /100 | #98 | Exceptional 93.5% |
| Menominee | 98.7 /100 | #99 | Exceptional 93.5% |
| Immigrants | North Macedonia | 98.7 /100 | #100 | Exceptional 93.5% |
| Immigrants | Romania | 98.7 /100 | #101 | Exceptional 93.5% |
| Chippewa | 98.6 /100 | #102 | Exceptional 93.5% |
| Lebanese | 98.6 /100 | #103 | Exceptional 93.5% |
| Immigrants | Europe | 98.6 /100 | #104 | Exceptional 93.5% |
| Immigrants | Serbia | 98.6 /100 | #105 | Exceptional 93.5% |
| Immigrants | Croatia | 98.6 /100 | #106 | Exceptional 93.5% |
| Immigrants | Norway | 98.4 /100 | #107 | Exceptional 93.5% |
| Alaska Natives | 98.4 /100 | #108 | Exceptional 93.5% |
| Immigrants | Kuwait | 98.4 /100 | #109 | Exceptional 93.5% |
| Syrians | 98.4 /100 | #110 | Exceptional 93.4% |
| Yugoslavians | 98.1 /100 | #111 | Exceptional 93.4% |