Ghanaian vs Shoshone 4th Grade
COMPARE
Ghanaian
Shoshone
4th Grade
4th Grade Comparison
Ghanaians
Shoshone
97.0%
4TH GRADE
0.2/ 100
METRIC RATING
268th/ 347
METRIC RANK
97.9%
4TH GRADE
98.7/ 100
METRIC RATING
94th/ 347
METRIC RANK
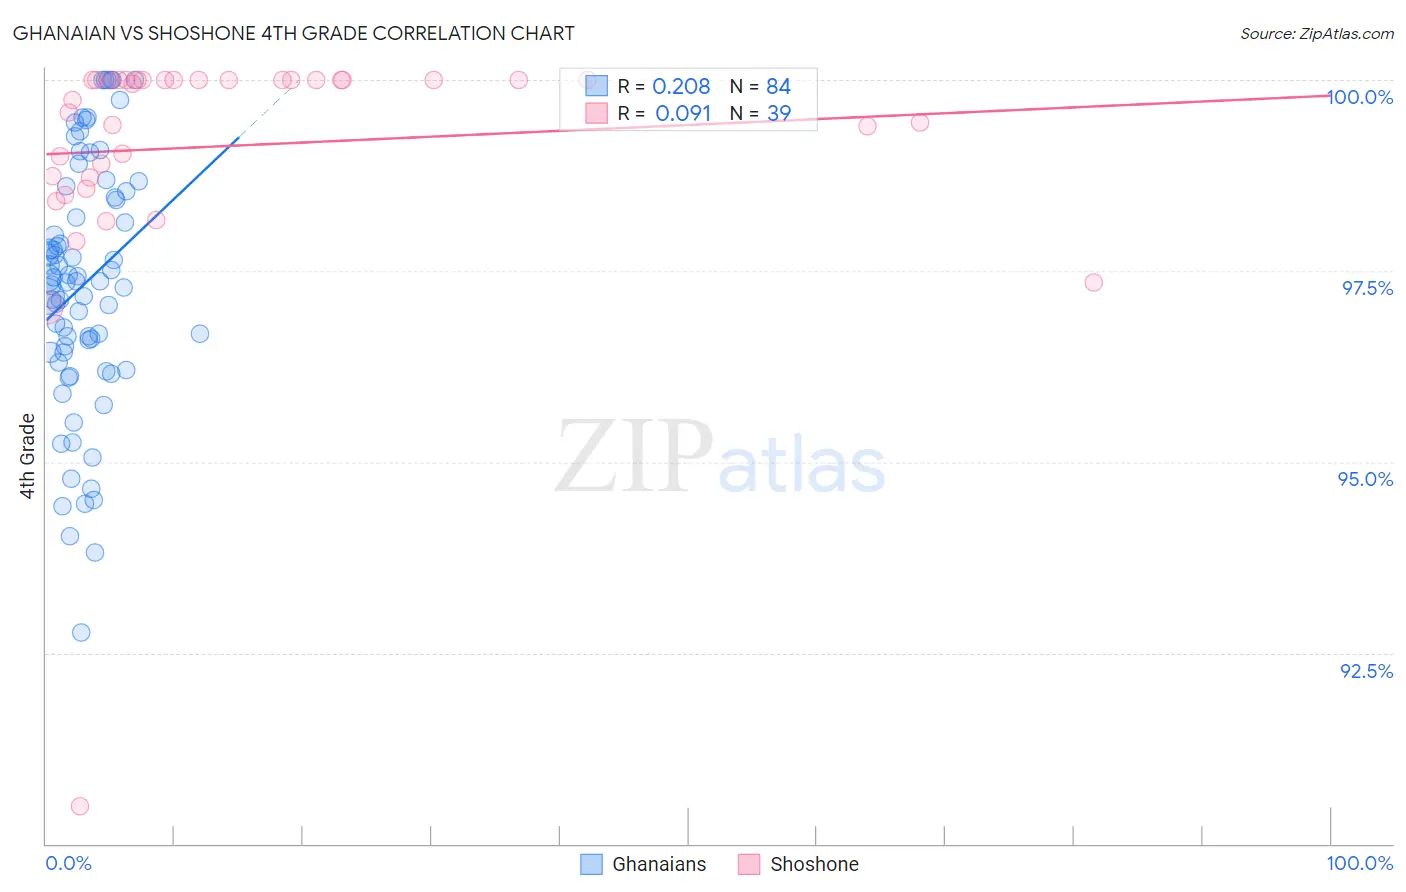
Ghanaian vs Shoshone 4th Grade Correlation Chart
The statistical analysis conducted on geographies consisting of 190,712,873 people shows a weak positive correlation between the proportion of Ghanaians and percentage of population with at least 4th grade education in the United States with a correlation coefficient (R) of 0.208 and weighted average of 97.0%. Similarly, the statistical analysis conducted on geographies consisting of 66,625,086 people shows a slight positive correlation between the proportion of Shoshone and percentage of population with at least 4th grade education in the United States with a correlation coefficient (R) of 0.091 and weighted average of 97.9%, a difference of 0.99%.
4th Grade Correlation Summary
| Measurement | Ghanaian | Shoshone |
| Minimum | 92.8% | 90.5% |
| Maximum | 100.0% | 100.0% |
| Range | 7.2% | 9.5% |
| Mean | 97.3% | 99.1% |
| Median | 97.4% | 99.9% |
| Interquartile 25% (IQ1) | 96.4% | 98.7% |
| Interquartile 75% (IQ3) | 98.5% | 100.0% |
| Interquartile Range (IQR) | 2.1% | 1.3% |
| Standard Deviation (Sample) | 1.6% | 1.6% |
| Standard Deviation (Population) | 1.6% | 1.6% |
Similar Demographics by 4th Grade
Demographics Similar to Ghanaians by 4th Grade
In terms of 4th grade, the demographic groups most similar to Ghanaians are Immigrants from China (97.0%, a difference of 0.010%), Immigrants from Nigeria (97.0%, a difference of 0.010%), Armenian (97.0%, a difference of 0.020%), Immigrants from Uzbekistan (96.9%, a difference of 0.020%), and Taiwanese (97.0%, a difference of 0.030%).
| Demographics | Rating | Rank | 4th Grade |
| Immigrants | South America | 0.4 /100 | #261 | Tragic 97.0% |
| West Indians | 0.4 /100 | #262 | Tragic 97.0% |
| Immigrants | Jamaica | 0.3 /100 | #263 | Tragic 97.0% |
| Taiwanese | 0.3 /100 | #264 | Tragic 97.0% |
| Armenians | 0.3 /100 | #265 | Tragic 97.0% |
| Immigrants | China | 0.3 /100 | #266 | Tragic 97.0% |
| Immigrants | Nigeria | 0.3 /100 | #267 | Tragic 97.0% |
| Ghanaians | 0.2 /100 | #268 | Tragic 97.0% |
| Immigrants | Uzbekistan | 0.2 /100 | #269 | Tragic 96.9% |
| Cubans | 0.2 /100 | #270 | Tragic 96.9% |
| Immigrants | Peru | 0.1 /100 | #271 | Tragic 96.9% |
| Fijians | 0.1 /100 | #272 | Tragic 96.9% |
| Immigrants | Cameroon | 0.1 /100 | #273 | Tragic 96.9% |
| Trinidadians and Tobagonians | 0.1 /100 | #274 | Tragic 96.9% |
| Immigrants | Ghana | 0.1 /100 | #275 | Tragic 96.9% |
Demographics Similar to Shoshone by 4th Grade
In terms of 4th grade, the demographic groups most similar to Shoshone are Immigrants from South Africa (97.9%, a difference of 0.0%), Delaware (97.9%, a difference of 0.0%), Immigrants from Denmark (97.9%, a difference of 0.0%), Immigrants from Sweden (97.9%, a difference of 0.0%), and Immigrants from Western Europe (97.9%, a difference of 0.0%).
| Demographics | Rating | Rank | 4th Grade |
| Zimbabweans | 98.8 /100 | #87 | Exceptional 97.9% |
| Immigrants | South Africa | 98.8 /100 | #88 | Exceptional 97.9% |
| Delaware | 98.8 /100 | #89 | Exceptional 97.9% |
| Immigrants | Denmark | 98.7 /100 | #90 | Exceptional 97.9% |
| Immigrants | Sweden | 98.7 /100 | #91 | Exceptional 97.9% |
| Immigrants | Western Europe | 98.7 /100 | #92 | Exceptional 97.9% |
| Immigrants | Ireland | 98.7 /100 | #93 | Exceptional 97.9% |
| Shoshone | 98.7 /100 | #94 | Exceptional 97.9% |
| Immigrants | Germany | 98.5 /100 | #95 | Exceptional 97.9% |
| Romanians | 98.4 /100 | #96 | Exceptional 97.9% |
| Cheyenne | 98.4 /100 | #97 | Exceptional 97.9% |
| South Africans | 98.2 /100 | #98 | Exceptional 97.9% |
| Turks | 98.2 /100 | #99 | Exceptional 97.9% |
| Yugoslavians | 98.1 /100 | #100 | Exceptional 97.9% |
| Cree | 98.1 /100 | #101 | Exceptional 97.9% |