German vs Immigrants from England 10th Grade
COMPARE
German
Immigrants from England
10th Grade
10th Grade Comparison
Germans
Immigrants from England
95.8%
10TH GRADE
100.0/ 100
METRIC RATING
7th/ 347
METRIC RANK
94.9%
10TH GRADE
99.6/ 100
METRIC RATING
69th/ 347
METRIC RANK
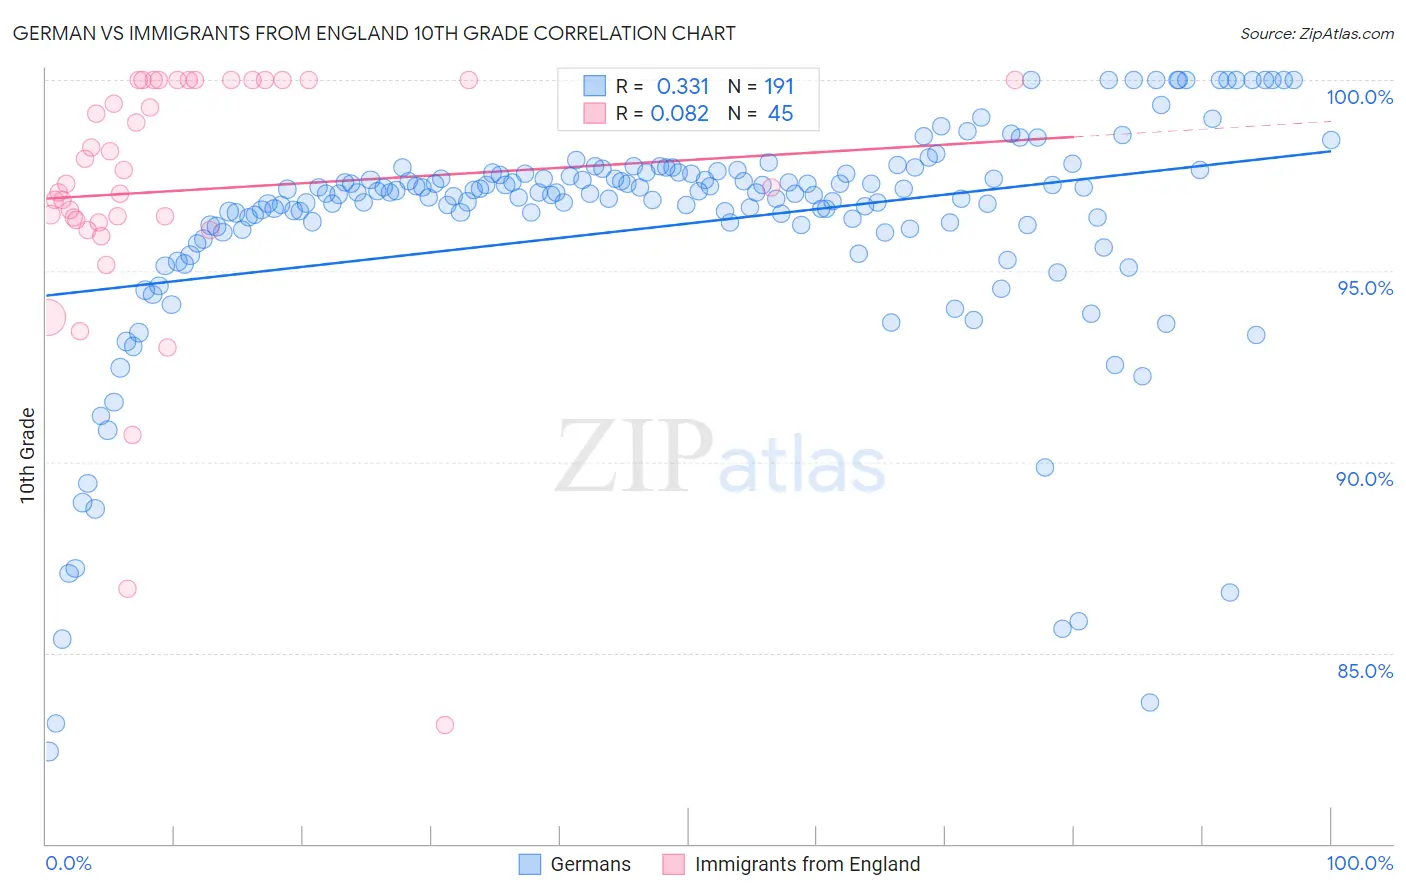
German vs Immigrants from England 10th Grade Correlation Chart
The statistical analysis conducted on geographies consisting of 581,302,287 people shows a mild positive correlation between the proportion of Germans and percentage of population with at least 10th grade education in the United States with a correlation coefficient (R) of 0.331 and weighted average of 95.8%. Similarly, the statistical analysis conducted on geographies consisting of 391,897,374 people shows a slight positive correlation between the proportion of Immigrants from England and percentage of population with at least 10th grade education in the United States with a correlation coefficient (R) of 0.082 and weighted average of 94.9%, a difference of 0.96%.
10th Grade Correlation Summary
| Measurement | German | Immigrants from England |
| Minimum | 82.4% | 83.1% |
| Maximum | 100.0% | 100.0% |
| Range | 17.6% | 16.9% |
| Mean | 96.2% | 97.1% |
| Median | 97.0% | 97.3% |
| Interquartile 25% (IQ1) | 96.1% | 96.3% |
| Interquartile 75% (IQ3) | 97.5% | 100.0% |
| Interquartile Range (IQR) | 1.4% | 3.7% |
| Standard Deviation (Sample) | 3.2% | 3.5% |
| Standard Deviation (Population) | 3.2% | 3.5% |
Similar Demographics by 10th Grade
Demographics Similar to Germans by 10th Grade
In terms of 10th grade, the demographic groups most similar to Germans are Polish (95.8%, a difference of 0.010%), Lithuanian (95.8%, a difference of 0.010%), Finnish (95.8%, a difference of 0.070%), Croatian (95.7%, a difference of 0.090%), and Carpatho Rusyn (95.9%, a difference of 0.11%).
| Demographics | Rating | Rank | 10th Grade |
| Norwegians | 100.0 /100 | #1 | Exceptional 96.2% |
| Slovaks | 100.0 /100 | #2 | Exceptional 96.0% |
| Slovenes | 100.0 /100 | #3 | Exceptional 95.9% |
| Swedes | 100.0 /100 | #4 | Exceptional 95.9% |
| Carpatho Rusyns | 100.0 /100 | #5 | Exceptional 95.9% |
| Poles | 100.0 /100 | #6 | Exceptional 95.8% |
| Germans | 100.0 /100 | #7 | Exceptional 95.8% |
| Lithuanians | 100.0 /100 | #8 | Exceptional 95.8% |
| Finns | 100.0 /100 | #9 | Exceptional 95.8% |
| Croatians | 100.0 /100 | #10 | Exceptional 95.7% |
| Danes | 100.0 /100 | #11 | Exceptional 95.7% |
| Tlingit-Haida | 100.0 /100 | #12 | Exceptional 95.7% |
| English | 100.0 /100 | #13 | Exceptional 95.6% |
| Tsimshian | 100.0 /100 | #14 | Exceptional 95.6% |
| Irish | 100.0 /100 | #15 | Exceptional 95.6% |
Demographics Similar to Immigrants from England by 10th Grade
In terms of 10th grade, the demographic groups most similar to Immigrants from England are Immigrants from Belgium (94.9%, a difference of 0.010%), Zimbabwean (94.9%, a difference of 0.010%), Alaska Native (94.9%, a difference of 0.010%), Immigrants from Australia (94.9%, a difference of 0.020%), and Immigrants from Netherlands (94.9%, a difference of 0.020%).
| Demographics | Rating | Rank | 10th Grade |
| Thais | 99.8 /100 | #62 | Exceptional 95.0% |
| Immigrants | Singapore | 99.8 /100 | #63 | Exceptional 95.0% |
| Native Hawaiians | 99.7 /100 | #64 | Exceptional 95.0% |
| Turks | 99.7 /100 | #65 | Exceptional 95.0% |
| Immigrants | Australia | 99.7 /100 | #66 | Exceptional 94.9% |
| Immigrants | Netherlands | 99.7 /100 | #67 | Exceptional 94.9% |
| Immigrants | Belgium | 99.7 /100 | #68 | Exceptional 94.9% |
| Immigrants | England | 99.6 /100 | #69 | Exceptional 94.9% |
| Zimbabweans | 99.6 /100 | #70 | Exceptional 94.9% |
| Alaska Natives | 99.6 /100 | #71 | Exceptional 94.9% |
| Immigrants | Sweden | 99.6 /100 | #72 | Exceptional 94.9% |
| Bhutanese | 99.6 /100 | #73 | Exceptional 94.9% |
| Canadians | 99.6 /100 | #74 | Exceptional 94.9% |
| Okinawans | 99.5 /100 | #75 | Exceptional 94.8% |
| Romanians | 99.5 /100 | #76 | Exceptional 94.8% |