Latvian vs Crow Professional Degree
COMPARE
Latvian
Crow
Professional Degree
Professional Degree Comparison
Latvians
Crow
6.2%
PROFESSIONAL DEGREE
100.0/ 100
METRIC RATING
26th/ 347
METRIC RANK
3.2%
PROFESSIONAL DEGREE
0.0/ 100
METRIC RATING
324th/ 347
METRIC RANK
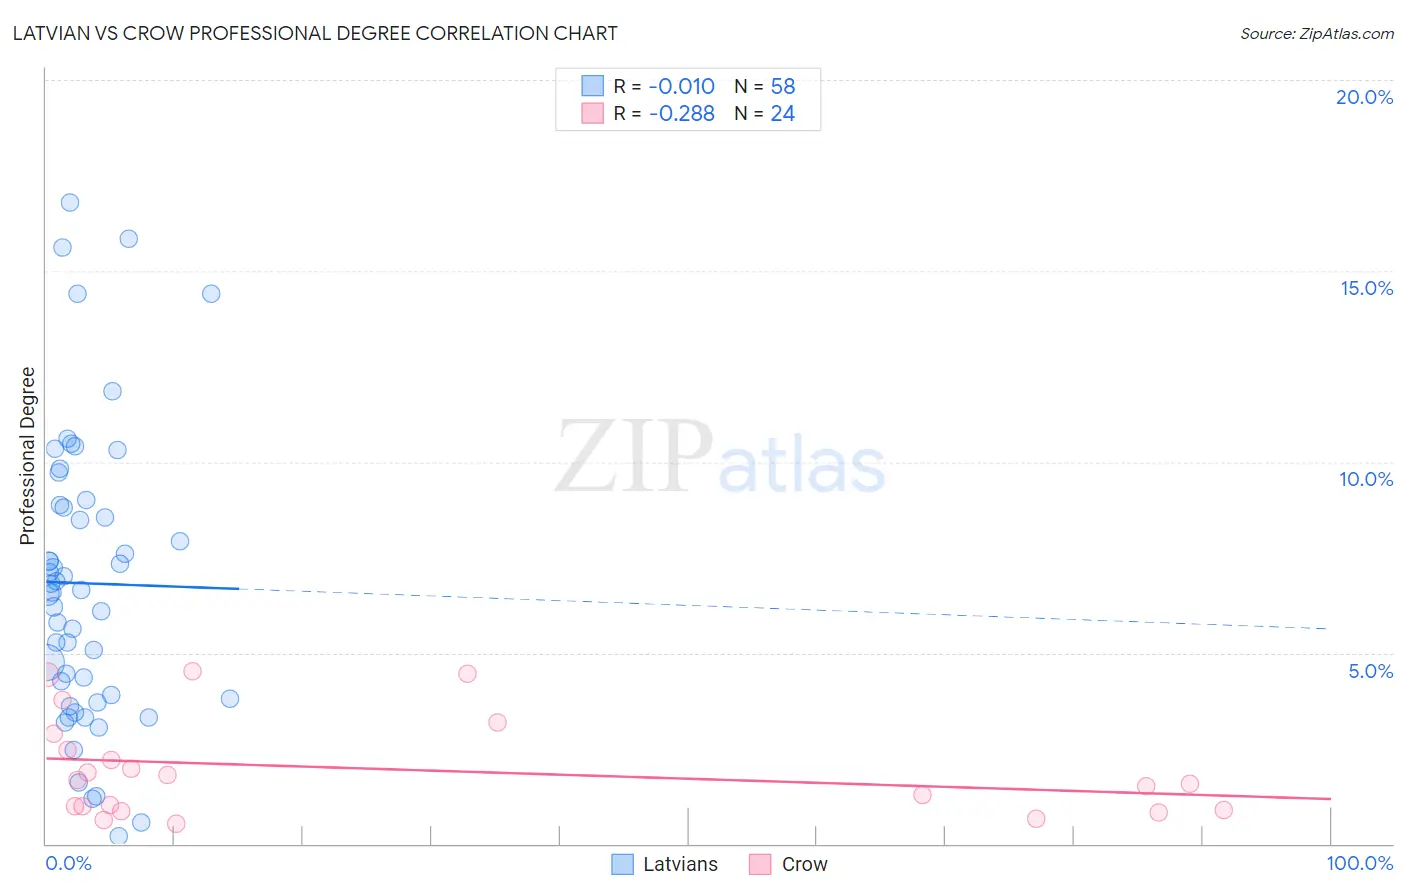
Latvian vs Crow Professional Degree Correlation Chart
The statistical analysis conducted on geographies consisting of 220,543,521 people shows no correlation between the proportion of Latvians and percentage of population with at least professional degree education in the United States with a correlation coefficient (R) of -0.010 and weighted average of 6.2%. Similarly, the statistical analysis conducted on geographies consisting of 59,107,625 people shows a weak negative correlation between the proportion of Crow and percentage of population with at least professional degree education in the United States with a correlation coefficient (R) of -0.288 and weighted average of 3.2%, a difference of 97.7%.
Professional Degree Correlation Summary
| Measurement | Latvian | Crow |
| Minimum | 0.19% | 0.53% |
| Maximum | 16.8% | 4.5% |
| Range | 16.6% | 4.0% |
| Mean | 6.8% | 2.0% |
| Median | 6.6% | 1.6% |
| Interquartile 25% (IQ1) | 3.8% | 0.93% |
| Interquartile 75% (IQ3) | 8.9% | 2.7% |
| Interquartile Range (IQR) | 5.1% | 1.7% |
| Standard Deviation (Sample) | 3.8% | 1.3% |
| Standard Deviation (Population) | 3.8% | 1.3% |
Similar Demographics by Professional Degree
Demographics Similar to Latvians by Professional Degree
In terms of professional degree, the demographic groups most similar to Latvians are Immigrants from Northern Europe (6.2%, a difference of 0.50%), Turkish (6.2%, a difference of 0.62%), Immigrants from Ireland (6.3%, a difference of 0.88%), Immigrants from Sri Lanka (6.2%, a difference of 1.3%), and Immigrants from Turkey (6.2%, a difference of 1.3%).
| Demographics | Rating | Rank | Professional Degree |
| Indians (Asian) | 100.0 /100 | #19 | Exceptional 6.5% |
| Immigrants | Denmark | 100.0 /100 | #20 | Exceptional 6.4% |
| Immigrants | Hong Kong | 100.0 /100 | #21 | Exceptional 6.4% |
| Immigrants | Japan | 100.0 /100 | #22 | Exceptional 6.4% |
| Russians | 100.0 /100 | #23 | Exceptional 6.3% |
| Immigrants | Spain | 100.0 /100 | #24 | Exceptional 6.3% |
| Immigrants | Ireland | 100.0 /100 | #25 | Exceptional 6.3% |
| Latvians | 100.0 /100 | #26 | Exceptional 6.2% |
| Immigrants | Northern Europe | 100.0 /100 | #27 | Exceptional 6.2% |
| Turks | 100.0 /100 | #28 | Exceptional 6.2% |
| Immigrants | Sri Lanka | 100.0 /100 | #29 | Exceptional 6.2% |
| Immigrants | Turkey | 100.0 /100 | #30 | Exceptional 6.2% |
| Immigrants | India | 100.0 /100 | #31 | Exceptional 6.2% |
| Thais | 100.0 /100 | #32 | Exceptional 6.1% |
| Burmese | 100.0 /100 | #33 | Exceptional 6.1% |
Demographics Similar to Crow by Professional Degree
In terms of professional degree, the demographic groups most similar to Crow are Yaqui (3.2%, a difference of 0.060%), Inupiat (3.2%, a difference of 0.27%), Hispanic or Latino (3.2%, a difference of 0.35%), Tsimshian (3.2%, a difference of 0.72%), and Seminole (3.2%, a difference of 1.1%).
| Demographics | Rating | Rank | Professional Degree |
| Nepalese | 0.1 /100 | #317 | Tragic 3.2% |
| Immigrants | Micronesia | 0.1 /100 | #318 | Tragic 3.2% |
| Choctaw | 0.1 /100 | #319 | Tragic 3.2% |
| Seminole | 0.1 /100 | #320 | Tragic 3.2% |
| Tsimshian | 0.0 /100 | #321 | Tragic 3.2% |
| Hispanics or Latinos | 0.0 /100 | #322 | Tragic 3.2% |
| Inupiat | 0.0 /100 | #323 | Tragic 3.2% |
| Crow | 0.0 /100 | #324 | Tragic 3.2% |
| Yaqui | 0.0 /100 | #325 | Tragic 3.2% |
| Menominee | 0.0 /100 | #326 | Tragic 3.1% |
| Dutch West Indians | 0.0 /100 | #327 | Tragic 3.1% |
| Creek | 0.0 /100 | #328 | Tragic 3.1% |
| Bangladeshis | 0.0 /100 | #329 | Tragic 3.1% |
| Immigrants | Cabo Verde | 0.0 /100 | #330 | Tragic 3.1% |
| Kiowa | 0.0 /100 | #331 | Tragic 3.1% |