Turkish vs Puget Sound Salish Master's Degree
COMPARE
Turkish
Puget Sound Salish
Master's Degree
Master's Degree Comparison
Turks
Puget Sound Salish
19.9%
MASTER'S DEGREE
100.0/ 100
METRIC RATING
28th/ 347
METRIC RANK
11.1%
MASTER'S DEGREE
0.0/ 100
METRIC RATING
309th/ 347
METRIC RANK
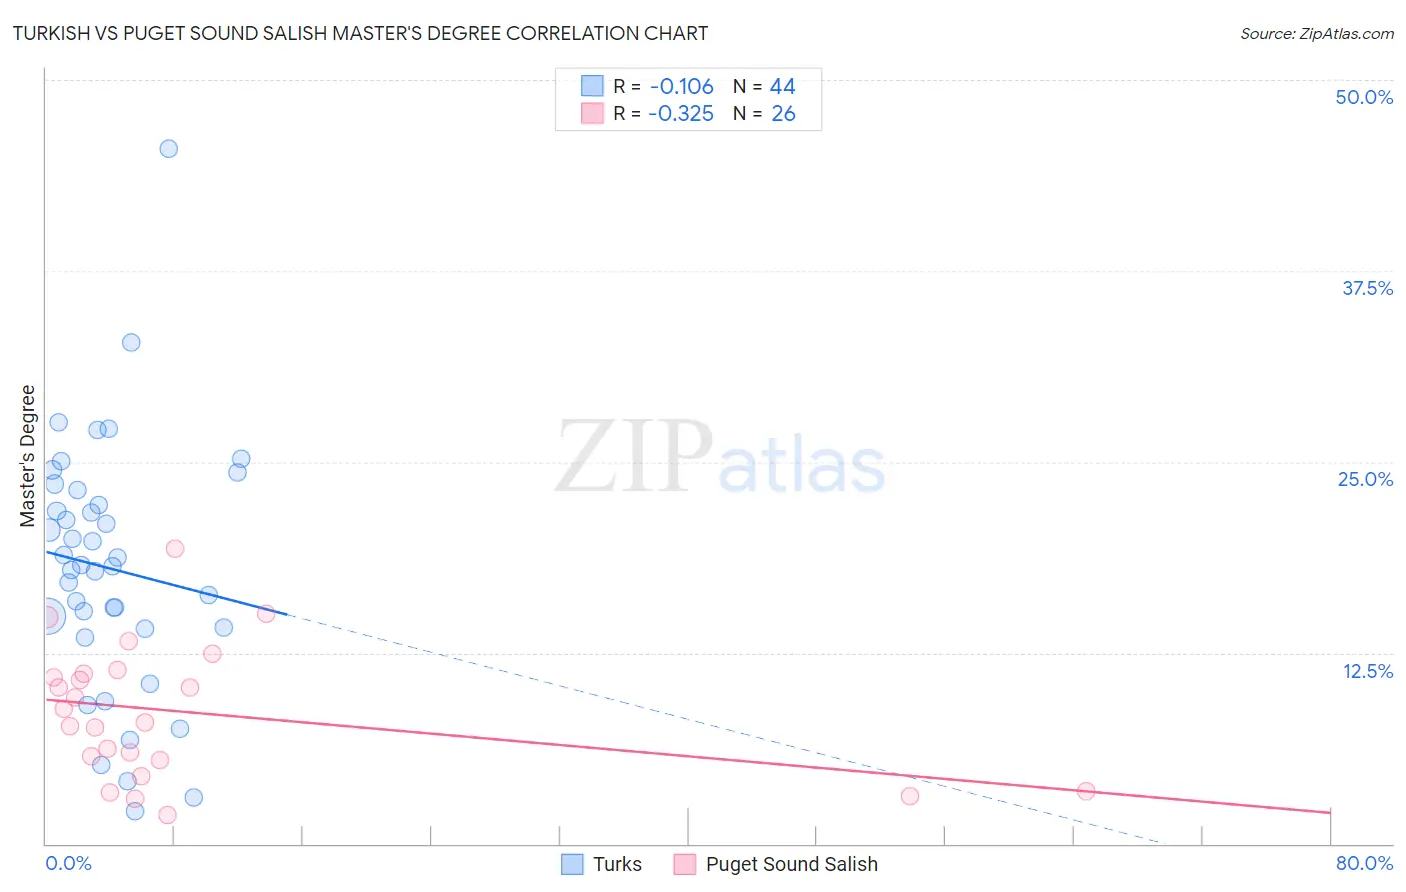
Turkish vs Puget Sound Salish Master's Degree Correlation Chart
The statistical analysis conducted on geographies consisting of 271,799,708 people shows a poor negative correlation between the proportion of Turks and percentage of population with at least master's degree education in the United States with a correlation coefficient (R) of -0.106 and weighted average of 19.9%. Similarly, the statistical analysis conducted on geographies consisting of 46,155,292 people shows a mild negative correlation between the proportion of Puget Sound Salish and percentage of population with at least master's degree education in the United States with a correlation coefficient (R) of -0.325 and weighted average of 11.1%, a difference of 78.6%.
Master's Degree Correlation Summary
| Measurement | Turkish | Puget Sound Salish |
| Minimum | 2.1% | 1.9% |
| Maximum | 45.5% | 19.3% |
| Range | 43.4% | 17.5% |
| Mean | 18.0% | 8.6% |
| Median | 18.2% | 8.4% |
| Interquartile 25% (IQ1) | 14.1% | 5.5% |
| Interquartile 75% (IQ3) | 22.6% | 11.1% |
| Interquartile Range (IQR) | 8.6% | 5.6% |
| Standard Deviation (Sample) | 8.2% | 4.4% |
| Standard Deviation (Population) | 8.2% | 4.3% |
Similar Demographics by Master's Degree
Demographics Similar to Turks by Master's Degree
In terms of master's degree, the demographic groups most similar to Turks are Immigrants from Sri Lanka (19.9%, a difference of 0.070%), Latvian (19.8%, a difference of 0.41%), Cambodian (20.0%, a difference of 0.48%), Immigrants from Japan (20.0%, a difference of 0.58%), and Immigrants from Turkey (19.7%, a difference of 0.92%).
| Demographics | Rating | Rank | Master's Degree |
| Immigrants | Ireland | 100.0 /100 | #21 | Exceptional 20.4% |
| Israelis | 100.0 /100 | #22 | Exceptional 20.3% |
| Immigrants | France | 100.0 /100 | #23 | Exceptional 20.3% |
| Immigrants | Sweden | 100.0 /100 | #24 | Exceptional 20.3% |
| Immigrants | Japan | 100.0 /100 | #25 | Exceptional 20.0% |
| Cambodians | 100.0 /100 | #26 | Exceptional 20.0% |
| Immigrants | Sri Lanka | 100.0 /100 | #27 | Exceptional 19.9% |
| Turks | 100.0 /100 | #28 | Exceptional 19.9% |
| Latvians | 100.0 /100 | #29 | Exceptional 19.8% |
| Immigrants | Turkey | 100.0 /100 | #30 | Exceptional 19.7% |
| Immigrants | Korea | 100.0 /100 | #31 | Exceptional 19.7% |
| Burmese | 100.0 /100 | #32 | Exceptional 19.7% |
| Russians | 100.0 /100 | #33 | Exceptional 19.5% |
| Immigrants | Denmark | 100.0 /100 | #34 | Exceptional 19.5% |
| Immigrants | Northern Europe | 100.0 /100 | #35 | Exceptional 19.5% |
Demographics Similar to Puget Sound Salish by Master's Degree
In terms of master's degree, the demographic groups most similar to Puget Sound Salish are Puerto Rican (11.2%, a difference of 0.29%), Shoshone (11.1%, a difference of 0.36%), Cheyenne (11.2%, a difference of 0.84%), Seminole (11.0%, a difference of 0.87%), and Choctaw (11.0%, a difference of 0.97%).
| Demographics | Rating | Rank | Master's Degree |
| Cherokee | 0.1 /100 | #302 | Tragic 11.4% |
| Immigrants | Laos | 0.1 /100 | #303 | Tragic 11.4% |
| Immigrants | Cabo Verde | 0.1 /100 | #304 | Tragic 11.3% |
| Immigrants | Latin America | 0.0 /100 | #305 | Tragic 11.3% |
| Mexican American Indians | 0.0 /100 | #306 | Tragic 11.2% |
| Cheyenne | 0.0 /100 | #307 | Tragic 11.2% |
| Puerto Ricans | 0.0 /100 | #308 | Tragic 11.2% |
| Puget Sound Salish | 0.0 /100 | #309 | Tragic 11.1% |
| Shoshone | 0.0 /100 | #310 | Tragic 11.1% |
| Seminole | 0.0 /100 | #311 | Tragic 11.0% |
| Choctaw | 0.0 /100 | #312 | Tragic 11.0% |
| Yaqui | 0.0 /100 | #313 | Tragic 11.0% |
| Cajuns | 0.0 /100 | #314 | Tragic 11.0% |
| Apache | 0.0 /100 | #315 | Tragic 11.0% |
| Hispanics or Latinos | 0.0 /100 | #316 | Tragic 10.9% |