French vs Osage Disability Age 18 to 34
COMPARE
French
Osage
Disability Age 18 to 34
Disability Age 18 to 34 Comparison
French
Osage
7.9%
DISABILITY AGE 18 TO 34
0.0/ 100
METRIC RATING
311th/ 347
METRIC RANK
8.3%
DISABILITY AGE 18 TO 34
0.0/ 100
METRIC RATING
330th/ 347
METRIC RANK
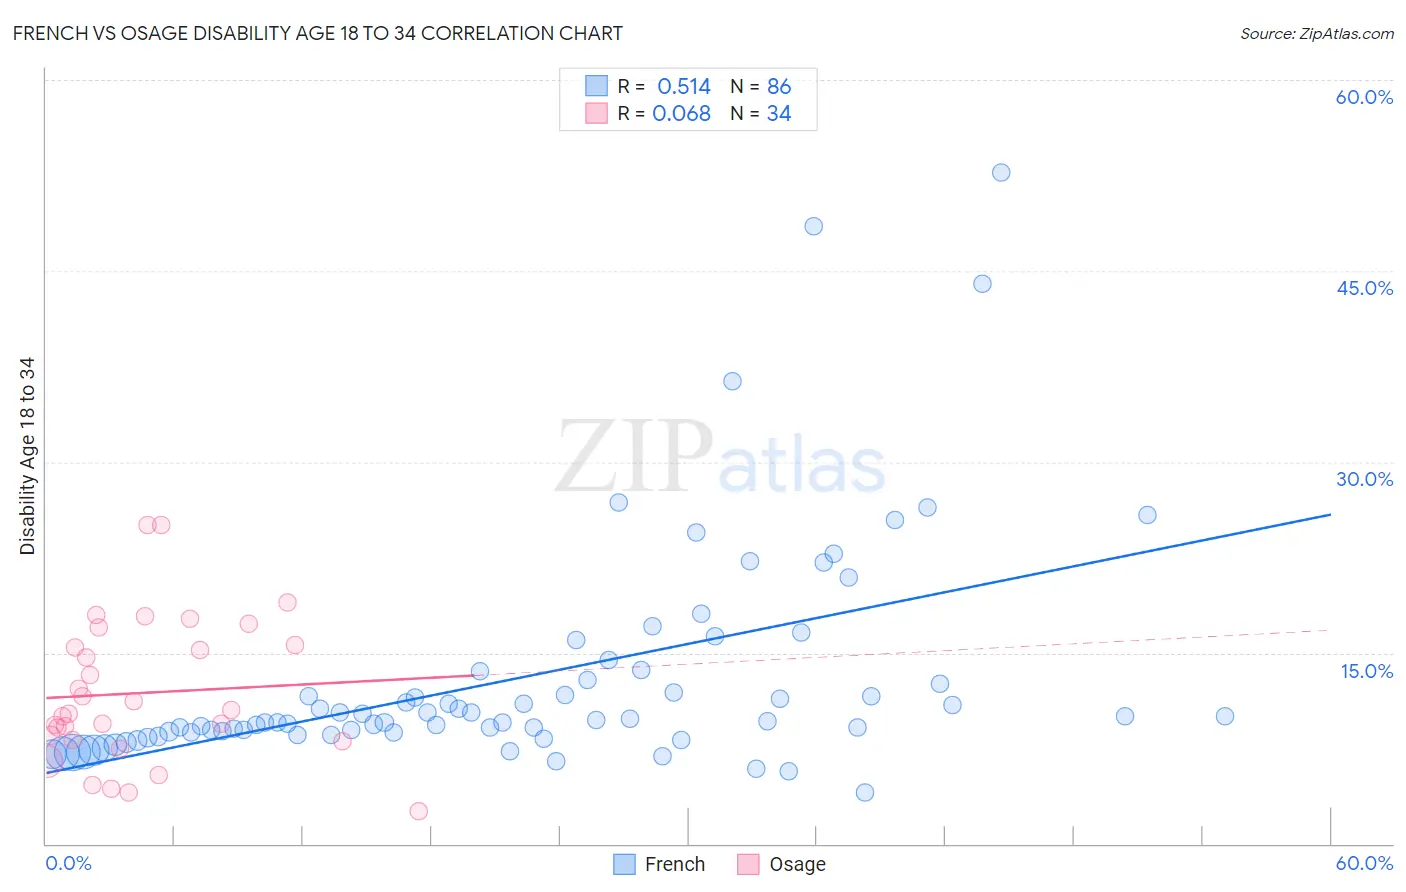
French vs Osage Disability Age 18 to 34 Correlation Chart
The statistical analysis conducted on geographies consisting of 566,388,287 people shows a substantial positive correlation between the proportion of French and percentage of population with a disability between the ages 18 and 35 in the United States with a correlation coefficient (R) of 0.514 and weighted average of 7.9%. Similarly, the statistical analysis conducted on geographies consisting of 91,736,463 people shows a slight positive correlation between the proportion of Osage and percentage of population with a disability between the ages 18 and 35 in the United States with a correlation coefficient (R) of 0.068 and weighted average of 8.3%, a difference of 5.4%.
Disability Age 18 to 34 Correlation Summary
| Measurement | French | Osage |
| Minimum | 4.0% | 2.5% |
| Maximum | 52.8% | 25.0% |
| Range | 48.7% | 22.5% |
| Mean | 13.0% | 11.8% |
| Median | 9.6% | 10.4% |
| Interquartile 25% (IQ1) | 8.7% | 8.1% |
| Interquartile 75% (IQ3) | 12.9% | 15.6% |
| Interquartile Range (IQR) | 4.1% | 7.4% |
| Standard Deviation (Sample) | 8.9% | 5.6% |
| Standard Deviation (Population) | 8.8% | 5.5% |
Demographics Similar to French and Osage by Disability Age 18 to 34
In terms of disability age 18 to 34, the demographic groups most similar to French are Spanish American (7.9%, a difference of 0.36%), Iroquois (7.9%, a difference of 0.40%), Finnish (7.8%, a difference of 0.75%), Colville (7.9%, a difference of 0.84%), and American (8.0%, a difference of 1.6%). Similarly, the demographic groups most similar to Osage are Crow (8.3%, a difference of 0.25%), Delaware (8.2%, a difference of 0.78%), Sioux (8.2%, a difference of 0.82%), Potawatomi (8.2%, a difference of 0.95%), and Native/Alaskan (8.2%, a difference of 0.97%).
| Demographics | Rating | Rank | Disability Age 18 to 34 |
| Finns | 0.0 /100 | #310 | Tragic 7.8% |
| French | 0.0 /100 | #311 | Tragic 7.9% |
| Spanish Americans | 0.0 /100 | #312 | Tragic 7.9% |
| Iroquois | 0.0 /100 | #313 | Tragic 7.9% |
| Colville | 0.0 /100 | #314 | Tragic 7.9% |
| Americans | 0.0 /100 | #315 | Tragic 8.0% |
| Puerto Ricans | 0.0 /100 | #316 | Tragic 8.0% |
| Hmong | 0.0 /100 | #317 | Tragic 8.1% |
| French Canadians | 0.0 /100 | #318 | Tragic 8.1% |
| Aleuts | 0.0 /100 | #319 | Tragic 8.1% |
| Navajo | 0.0 /100 | #320 | Tragic 8.1% |
| Blackfeet | 0.0 /100 | #321 | Tragic 8.1% |
| Cree | 0.0 /100 | #322 | Tragic 8.1% |
| French American Indians | 0.0 /100 | #323 | Tragic 8.2% |
| Cajuns | 0.0 /100 | #324 | Tragic 8.2% |
| Natives/Alaskans | 0.0 /100 | #325 | Tragic 8.2% |
| Potawatomi | 0.0 /100 | #326 | Tragic 8.2% |
| Sioux | 0.0 /100 | #327 | Tragic 8.2% |
| Delaware | 0.0 /100 | #328 | Tragic 8.2% |
| Crow | 0.0 /100 | #329 | Tragic 8.3% |
| Osage | 0.0 /100 | #330 | Tragic 8.3% |