French vs Immigrants from Southern Europe 9th Grade
COMPARE
French
Immigrants from Southern Europe
9th Grade
9th Grade Comparison
French
Immigrants from Southern Europe
96.3%
9TH GRADE
100.0/ 100
METRIC RATING
25th/ 347
METRIC RANK
94.3%
9TH GRADE
4.5/ 100
METRIC RATING
229th/ 347
METRIC RANK
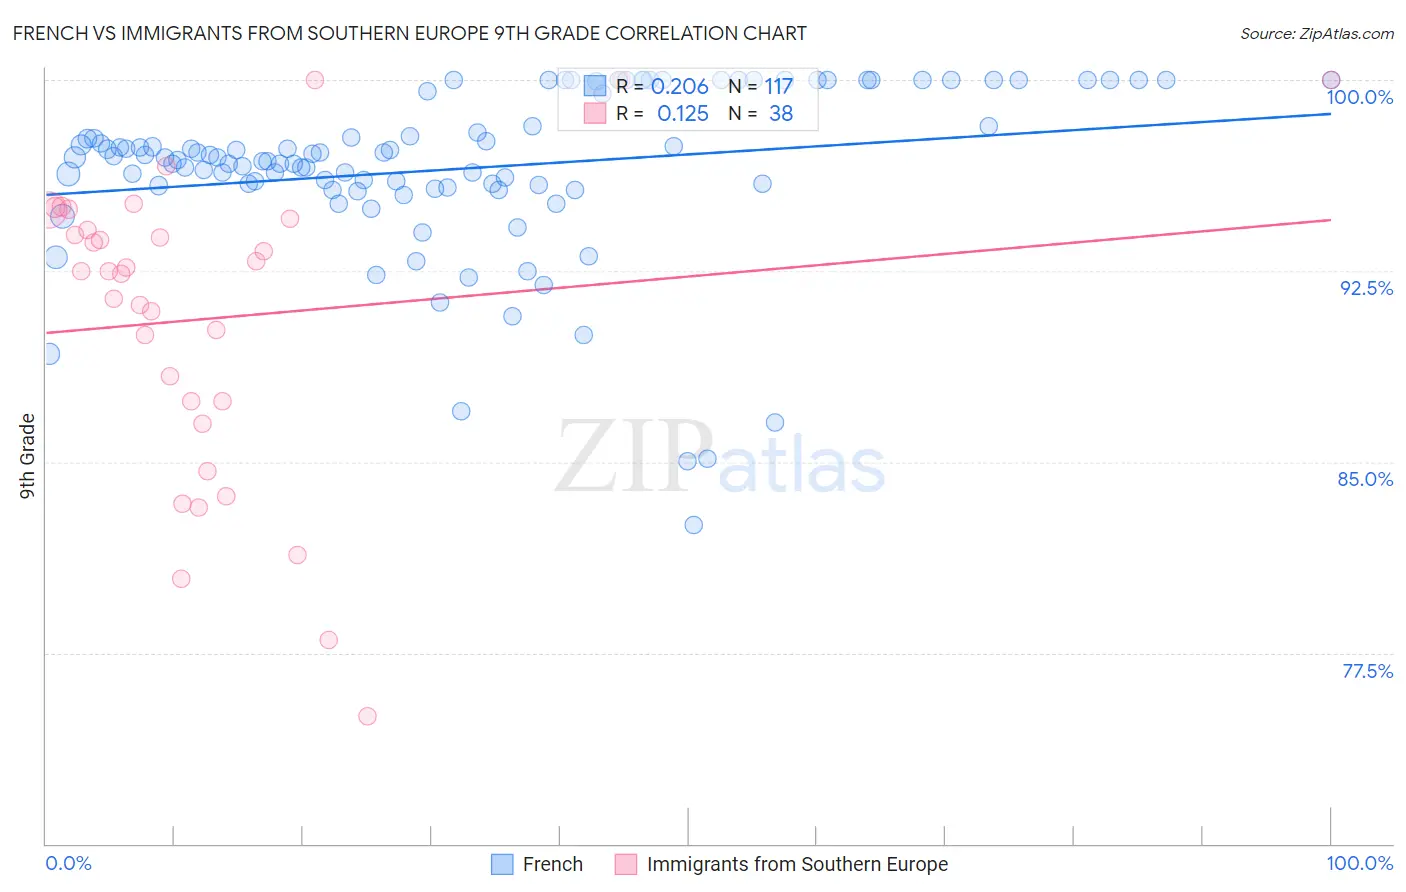
French vs Immigrants from Southern Europe 9th Grade Correlation Chart
The statistical analysis conducted on geographies consisting of 572,427,255 people shows a weak positive correlation between the proportion of French and percentage of population with at least 9th grade education in the United States with a correlation coefficient (R) of 0.206 and weighted average of 96.3%. Similarly, the statistical analysis conducted on geographies consisting of 402,804,595 people shows a poor positive correlation between the proportion of Immigrants from Southern Europe and percentage of population with at least 9th grade education in the United States with a correlation coefficient (R) of 0.125 and weighted average of 94.3%, a difference of 2.1%.
9th Grade Correlation Summary
| Measurement | French | Immigrants from Southern Europe |
| Minimum | 82.5% | 75.0% |
| Maximum | 100.0% | 100.0% |
| Range | 17.5% | 25.0% |
| Mean | 96.5% | 90.6% |
| Median | 96.9% | 92.5% |
| Interquartile 25% (IQ1) | 95.8% | 87.4% |
| Interquartile 75% (IQ3) | 99.5% | 94.6% |
| Interquartile Range (IQR) | 3.7% | 7.2% |
| Standard Deviation (Sample) | 3.4% | 6.0% |
| Standard Deviation (Population) | 3.4% | 5.9% |
Similar Demographics by 9th Grade
Demographics Similar to French by 9th Grade
In terms of 9th grade, the demographic groups most similar to French are Latvian (96.4%, a difference of 0.010%), French Canadian (96.3%, a difference of 0.030%), Czech (96.4%, a difference of 0.040%), Scotch-Irish (96.3%, a difference of 0.040%), and Eastern European (96.3%, a difference of 0.040%).
| Demographics | Rating | Rank | 9th Grade |
| Scandinavians | 100.0 /100 | #18 | Exceptional 96.5% |
| Welsh | 100.0 /100 | #19 | Exceptional 96.4% |
| Italians | 100.0 /100 | #20 | Exceptional 96.4% |
| Alaskan Athabascans | 100.0 /100 | #21 | Exceptional 96.4% |
| Europeans | 100.0 /100 | #22 | Exceptional 96.4% |
| Czechs | 100.0 /100 | #23 | Exceptional 96.4% |
| Latvians | 100.0 /100 | #24 | Exceptional 96.4% |
| French | 100.0 /100 | #25 | Exceptional 96.3% |
| French Canadians | 100.0 /100 | #26 | Exceptional 96.3% |
| Scotch-Irish | 100.0 /100 | #27 | Exceptional 96.3% |
| Eastern Europeans | 100.0 /100 | #28 | Exceptional 96.3% |
| Chinese | 100.0 /100 | #29 | Exceptional 96.3% |
| Maltese | 100.0 /100 | #30 | Exceptional 96.3% |
| British | 100.0 /100 | #31 | Exceptional 96.3% |
| Belgians | 100.0 /100 | #32 | Exceptional 96.3% |
Demographics Similar to Immigrants from Southern Europe by 9th Grade
In terms of 9th grade, the demographic groups most similar to Immigrants from Southern Europe are Immigrants from Sierra Leone (94.4%, a difference of 0.010%), Lumbee (94.4%, a difference of 0.010%), Apache (94.3%, a difference of 0.020%), Immigrants from Panama (94.3%, a difference of 0.020%), and Ethiopian (94.4%, a difference of 0.030%).
| Demographics | Rating | Rank | 9th Grade |
| Immigrants | Asia | 7.7 /100 | #222 | Tragic 94.4% |
| Bahamians | 7.0 /100 | #223 | Tragic 94.4% |
| Tongans | 6.0 /100 | #224 | Tragic 94.4% |
| Ethiopians | 5.4 /100 | #225 | Tragic 94.4% |
| Sub-Saharan Africans | 5.4 /100 | #226 | Tragic 94.4% |
| Immigrants | Sierra Leone | 4.8 /100 | #227 | Tragic 94.4% |
| Lumbee | 4.7 /100 | #228 | Tragic 94.4% |
| Immigrants | Southern Europe | 4.5 /100 | #229 | Tragic 94.3% |
| Apache | 4.2 /100 | #230 | Tragic 94.3% |
| Immigrants | Panama | 4.0 /100 | #231 | Tragic 94.3% |
| Immigrants | Africa | 3.9 /100 | #232 | Tragic 94.3% |
| Nigerians | 3.7 /100 | #233 | Tragic 94.3% |
| Costa Ricans | 3.5 /100 | #234 | Tragic 94.3% |
| Bolivians | 3.3 /100 | #235 | Tragic 94.3% |
| Somalis | 2.9 /100 | #236 | Tragic 94.3% |