French Canadian vs Malaysian 7th Grade
COMPARE
French Canadian
Malaysian
7th Grade
7th Grade Comparison
French Canadians
Malaysians
97.4%
7TH GRADE
100.0/ 100
METRIC RATING
22nd/ 347
METRIC RANK
94.8%
7TH GRADE
0.0/ 100
METRIC RATING
290th/ 347
METRIC RANK
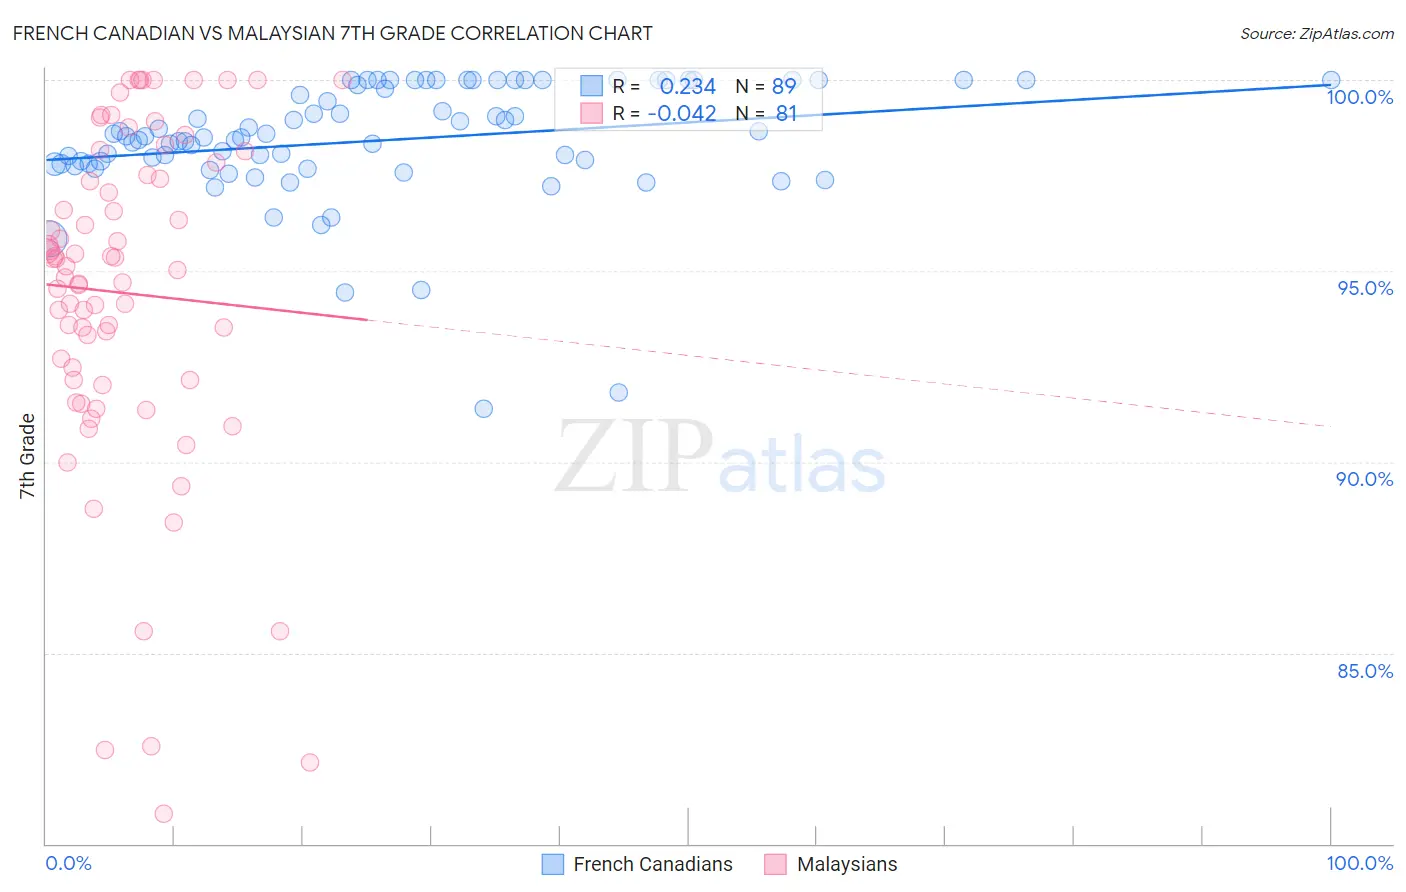
French Canadian vs Malaysian 7th Grade Correlation Chart
The statistical analysis conducted on geographies consisting of 502,678,839 people shows a weak positive correlation between the proportion of French Canadians and percentage of population with at least 7th grade education in the United States with a correlation coefficient (R) of 0.234 and weighted average of 97.4%. Similarly, the statistical analysis conducted on geographies consisting of 226,107,000 people shows no correlation between the proportion of Malaysians and percentage of population with at least 7th grade education in the United States with a correlation coefficient (R) of -0.042 and weighted average of 94.8%, a difference of 2.8%.
7th Grade Correlation Summary
| Measurement | French Canadian | Malaysian |
| Minimum | 91.4% | 80.8% |
| Maximum | 100.0% | 100.0% |
| Range | 8.6% | 19.2% |
| Mean | 98.4% | 94.4% |
| Median | 98.5% | 95.1% |
| Interquartile 25% (IQ1) | 97.8% | 92.1% |
| Interquartile 75% (IQ3) | 100.0% | 97.7% |
| Interquartile Range (IQR) | 2.2% | 5.5% |
| Standard Deviation (Sample) | 1.6% | 4.4% |
| Standard Deviation (Population) | 1.6% | 4.4% |
Similar Demographics by 7th Grade
Demographics Similar to French Canadians by 7th Grade
In terms of 7th grade, the demographic groups most similar to French Canadians are Inupiat (97.4%, a difference of 0.0%), Yup'ik (97.4%, a difference of 0.020%), Croatian (97.4%, a difference of 0.020%), Welsh (97.4%, a difference of 0.030%), and French (97.4%, a difference of 0.030%).
| Demographics | Rating | Rank | 7th Grade |
| English | 100.0 /100 | #15 | Exceptional 97.6% |
| Irish | 100.0 /100 | #16 | Exceptional 97.5% |
| Scottish | 100.0 /100 | #17 | Exceptional 97.5% |
| Tlingit-Haida | 100.0 /100 | #18 | Exceptional 97.5% |
| Lithuanians | 100.0 /100 | #19 | Exceptional 97.5% |
| Yup'ik | 100.0 /100 | #20 | Exceptional 97.4% |
| Inupiat | 100.0 /100 | #21 | Exceptional 97.4% |
| French Canadians | 100.0 /100 | #22 | Exceptional 97.4% |
| Croatians | 100.0 /100 | #23 | Exceptional 97.4% |
| Welsh | 100.0 /100 | #24 | Exceptional 97.4% |
| French | 100.0 /100 | #25 | Exceptional 97.4% |
| Scotch-Irish | 100.0 /100 | #26 | Exceptional 97.4% |
| Danes | 100.0 /100 | #27 | Exceptional 97.4% |
| Sioux | 100.0 /100 | #28 | Exceptional 97.4% |
| Scandinavians | 100.0 /100 | #29 | Exceptional 97.4% |
Demographics Similar to Malaysians by 7th Grade
In terms of 7th grade, the demographic groups most similar to Malaysians are Taiwanese (94.8%, a difference of 0.020%), British West Indian (94.8%, a difference of 0.030%), Immigrants from Grenada (94.8%, a difference of 0.040%), Immigrants from Peru (94.9%, a difference of 0.050%), and Immigrants from Philippines (94.9%, a difference of 0.060%).
| Demographics | Rating | Rank | 7th Grade |
| Immigrants | Barbados | 0.1 /100 | #283 | Tragic 95.0% |
| Armenians | 0.1 /100 | #284 | Tragic 95.0% |
| Immigrants | Eritrea | 0.1 /100 | #285 | Tragic 94.9% |
| Immigrants | Philippines | 0.0 /100 | #286 | Tragic 94.9% |
| Immigrants | Peru | 0.0 /100 | #287 | Tragic 94.9% |
| British West Indians | 0.0 /100 | #288 | Tragic 94.8% |
| Taiwanese | 0.0 /100 | #289 | Tragic 94.8% |
| Malaysians | 0.0 /100 | #290 | Tragic 94.8% |
| Immigrants | Grenada | 0.0 /100 | #291 | Tragic 94.8% |
| Immigrants | West Indies | 0.0 /100 | #292 | Tragic 94.8% |
| Fijians | 0.0 /100 | #293 | Tragic 94.7% |
| Haitians | 0.0 /100 | #294 | Tragic 94.7% |
| Yaqui | 0.0 /100 | #295 | Tragic 94.6% |
| Cubans | 0.0 /100 | #296 | Tragic 94.6% |
| Immigrants | South Eastern Asia | 0.0 /100 | #297 | Tragic 94.5% |