Immigrants from Thailand vs Malaysian 7th Grade
COMPARE
Immigrants from Thailand
Malaysian
7th Grade
7th Grade Comparison
Immigrants from Thailand
Malaysians
95.1%
7TH GRADE
0.2/ 100
METRIC RATING
276th/ 347
METRIC RANK
94.8%
7TH GRADE
0.0/ 100
METRIC RATING
290th/ 347
METRIC RANK
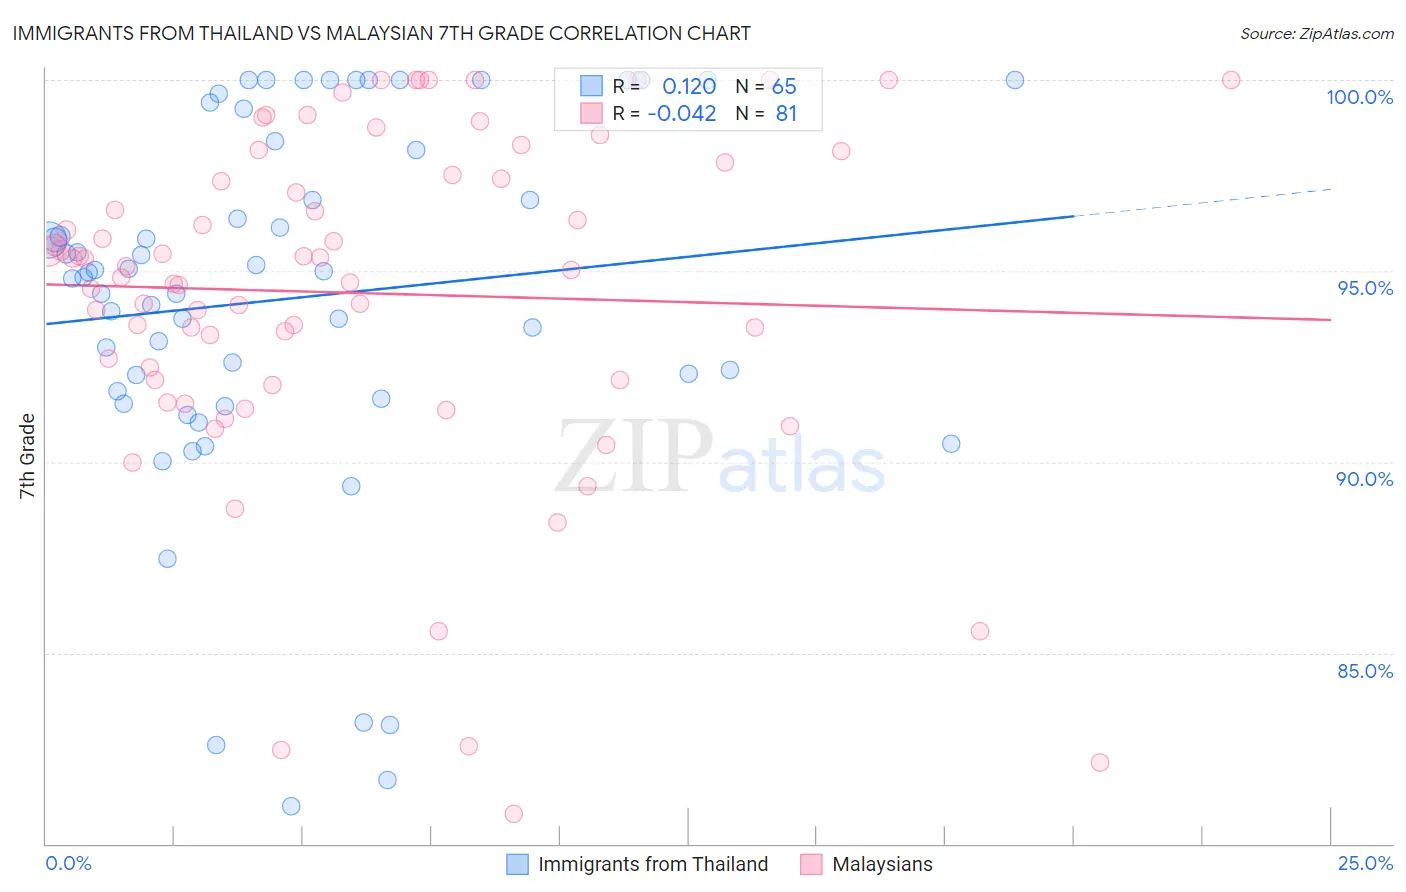
Immigrants from Thailand vs Malaysian 7th Grade Correlation Chart
The statistical analysis conducted on geographies consisting of 317,023,903 people shows a poor positive correlation between the proportion of Immigrants from Thailand and percentage of population with at least 7th grade education in the United States with a correlation coefficient (R) of 0.120 and weighted average of 95.1%. Similarly, the statistical analysis conducted on geographies consisting of 226,107,000 people shows no correlation between the proportion of Malaysians and percentage of population with at least 7th grade education in the United States with a correlation coefficient (R) of -0.042 and weighted average of 94.8%, a difference of 0.30%.
7th Grade Correlation Summary
| Measurement | Immigrants from Thailand | Malaysian |
| Minimum | 81.0% | 80.8% |
| Maximum | 100.0% | 100.0% |
| Range | 19.0% | 19.2% |
| Mean | 94.3% | 94.4% |
| Median | 94.9% | 95.1% |
| Interquartile 25% (IQ1) | 91.8% | 92.1% |
| Interquartile 75% (IQ3) | 98.3% | 97.7% |
| Interquartile Range (IQR) | 6.5% | 5.5% |
| Standard Deviation (Sample) | 4.8% | 4.4% |
| Standard Deviation (Population) | 4.7% | 4.4% |
Demographics Similar to Immigrants from Thailand and Malaysians by 7th Grade
In terms of 7th grade, the demographic groups most similar to Immigrants from Thailand are Immigrants from Colombia (95.1%, a difference of 0.020%), Immigrants from Afghanistan (95.1%, a difference of 0.020%), Immigrants from Uzbekistan (95.1%, a difference of 0.030%), Immigrants from Western Africa (95.1%, a difference of 0.030%), and Immigrants from Trinidad and Tobago (95.1%, a difference of 0.050%). Similarly, the demographic groups most similar to Malaysians are Taiwanese (94.8%, a difference of 0.020%), British West Indian (94.8%, a difference of 0.030%), Immigrants from Grenada (94.8%, a difference of 0.040%), Immigrants from Peru (94.9%, a difference of 0.050%), and Immigrants from Philippines (94.9%, a difference of 0.060%).
| Demographics | Rating | Rank | 7th Grade |
| Immigrants | Uzbekistan | 0.2 /100 | #273 | Tragic 95.1% |
| Immigrants | Western Africa | 0.2 /100 | #274 | Tragic 95.1% |
| Immigrants | Colombia | 0.2 /100 | #275 | Tragic 95.1% |
| Immigrants | Thailand | 0.2 /100 | #276 | Tragic 95.1% |
| Immigrants | Afghanistan | 0.2 /100 | #277 | Tragic 95.1% |
| Immigrants | Trinidad and Tobago | 0.1 /100 | #278 | Tragic 95.1% |
| Barbadians | 0.1 /100 | #279 | Tragic 95.1% |
| Immigrants | St. Vincent and the Grenadines | 0.1 /100 | #280 | Tragic 95.0% |
| Tohono O'odham | 0.1 /100 | #281 | Tragic 95.0% |
| Immigrants | Bolivia | 0.1 /100 | #282 | Tragic 95.0% |
| Immigrants | Barbados | 0.1 /100 | #283 | Tragic 95.0% |
| Armenians | 0.1 /100 | #284 | Tragic 95.0% |
| Immigrants | Eritrea | 0.1 /100 | #285 | Tragic 94.9% |
| Immigrants | Philippines | 0.0 /100 | #286 | Tragic 94.9% |
| Immigrants | Peru | 0.0 /100 | #287 | Tragic 94.9% |
| British West Indians | 0.0 /100 | #288 | Tragic 94.8% |
| Taiwanese | 0.0 /100 | #289 | Tragic 94.8% |
| Malaysians | 0.0 /100 | #290 | Tragic 94.8% |
| Immigrants | Grenada | 0.0 /100 | #291 | Tragic 94.8% |
| Immigrants | West Indies | 0.0 /100 | #292 | Tragic 94.8% |
| Fijians | 0.0 /100 | #293 | Tragic 94.7% |