French Canadian vs Sudanese 7th Grade
COMPARE
French Canadian
Sudanese
7th Grade
7th Grade Comparison
French Canadians
Sudanese
97.4%
7TH GRADE
100.0/ 100
METRIC RATING
22nd/ 347
METRIC RANK
95.9%
7TH GRADE
28.1/ 100
METRIC RATING
195th/ 347
METRIC RANK
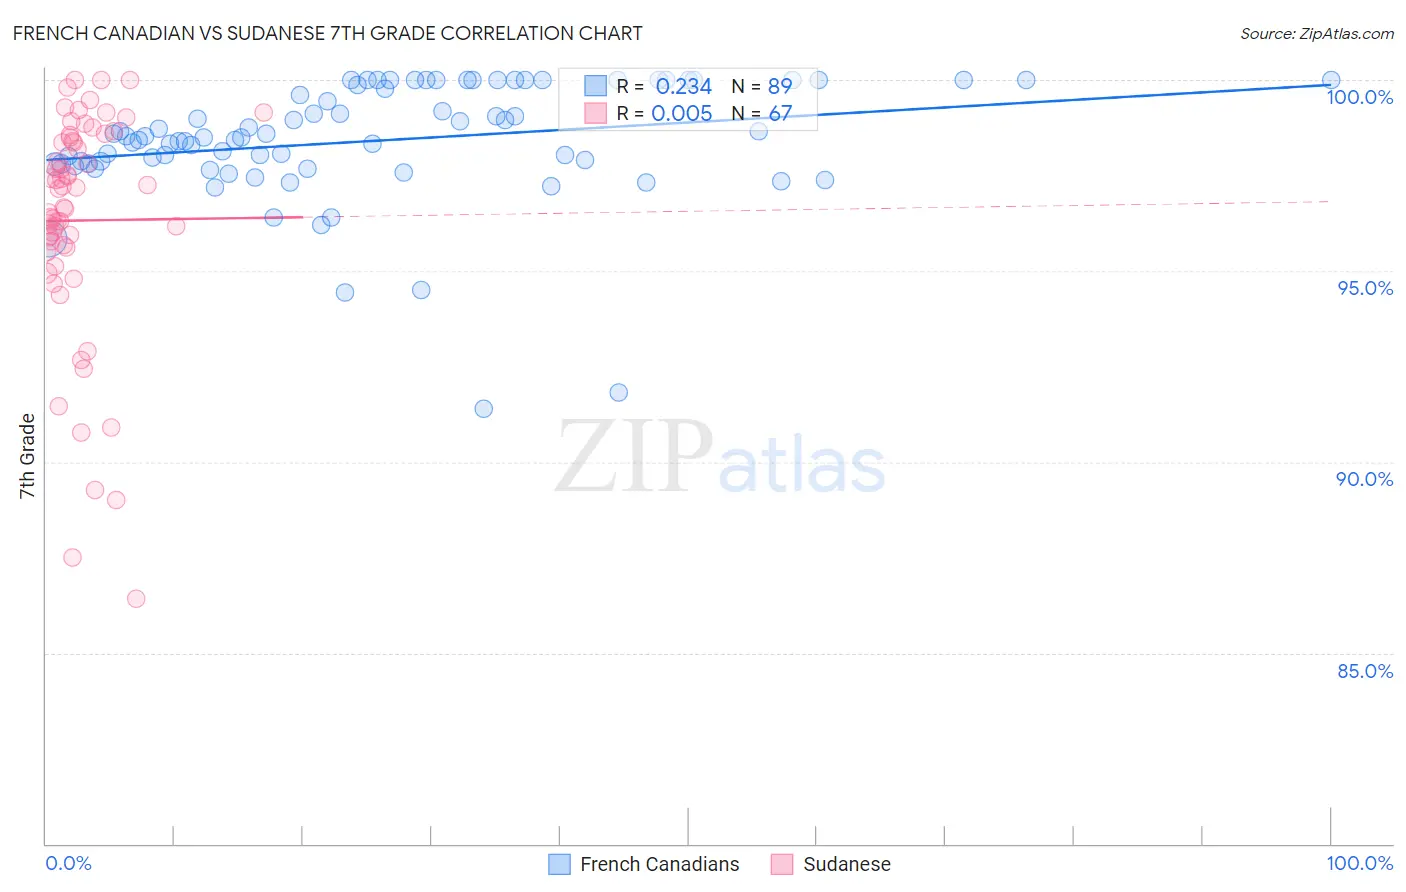
French Canadian vs Sudanese 7th Grade Correlation Chart
The statistical analysis conducted on geographies consisting of 502,678,839 people shows a weak positive correlation between the proportion of French Canadians and percentage of population with at least 7th grade education in the United States with a correlation coefficient (R) of 0.234 and weighted average of 97.4%. Similarly, the statistical analysis conducted on geographies consisting of 110,134,719 people shows no correlation between the proportion of Sudanese and percentage of population with at least 7th grade education in the United States with a correlation coefficient (R) of 0.005 and weighted average of 95.9%, a difference of 1.6%.
7th Grade Correlation Summary
| Measurement | French Canadian | Sudanese |
| Minimum | 91.4% | 86.4% |
| Maximum | 100.0% | 100.0% |
| Range | 8.6% | 13.6% |
| Mean | 98.4% | 96.3% |
| Median | 98.5% | 97.2% |
| Interquartile 25% (IQ1) | 97.8% | 95.6% |
| Interquartile 75% (IQ3) | 100.0% | 98.5% |
| Interquartile Range (IQR) | 2.2% | 2.9% |
| Standard Deviation (Sample) | 1.6% | 3.0% |
| Standard Deviation (Population) | 1.6% | 3.0% |
Similar Demographics by 7th Grade
Demographics Similar to French Canadians by 7th Grade
In terms of 7th grade, the demographic groups most similar to French Canadians are Inupiat (97.4%, a difference of 0.0%), Yup'ik (97.4%, a difference of 0.020%), Croatian (97.4%, a difference of 0.020%), Welsh (97.4%, a difference of 0.030%), and French (97.4%, a difference of 0.030%).
| Demographics | Rating | Rank | 7th Grade |
| English | 100.0 /100 | #15 | Exceptional 97.6% |
| Irish | 100.0 /100 | #16 | Exceptional 97.5% |
| Scottish | 100.0 /100 | #17 | Exceptional 97.5% |
| Tlingit-Haida | 100.0 /100 | #18 | Exceptional 97.5% |
| Lithuanians | 100.0 /100 | #19 | Exceptional 97.5% |
| Yup'ik | 100.0 /100 | #20 | Exceptional 97.4% |
| Inupiat | 100.0 /100 | #21 | Exceptional 97.4% |
| French Canadians | 100.0 /100 | #22 | Exceptional 97.4% |
| Croatians | 100.0 /100 | #23 | Exceptional 97.4% |
| Welsh | 100.0 /100 | #24 | Exceptional 97.4% |
| French | 100.0 /100 | #25 | Exceptional 97.4% |
| Scotch-Irish | 100.0 /100 | #26 | Exceptional 97.4% |
| Danes | 100.0 /100 | #27 | Exceptional 97.4% |
| Sioux | 100.0 /100 | #28 | Exceptional 97.4% |
| Scandinavians | 100.0 /100 | #29 | Exceptional 97.4% |
Demographics Similar to Sudanese by 7th Grade
In terms of 7th grade, the demographic groups most similar to Sudanese are Apache (95.9%, a difference of 0.0%), Immigrants from Nepal (95.9%, a difference of 0.010%), Immigrants from Zaire (95.9%, a difference of 0.010%), Immigrants from Bahamas (95.9%, a difference of 0.020%), and Immigrants from Micronesia (95.9%, a difference of 0.030%).
| Demographics | Rating | Rank | 7th Grade |
| Immigrants | Egypt | 34.3 /100 | #188 | Fair 95.9% |
| Immigrants | Venezuela | 33.9 /100 | #189 | Fair 95.9% |
| Immigrants | Micronesia | 32.6 /100 | #190 | Fair 95.9% |
| Liberians | 32.5 /100 | #191 | Fair 95.9% |
| Panamanians | 32.3 /100 | #192 | Fair 95.9% |
| Immigrants | Bahamas | 30.8 /100 | #193 | Fair 95.9% |
| Immigrants | Nepal | 30.0 /100 | #194 | Fair 95.9% |
| Sudanese | 28.1 /100 | #195 | Fair 95.9% |
| Apache | 27.6 /100 | #196 | Fair 95.9% |
| Immigrants | Zaire | 26.7 /100 | #197 | Fair 95.9% |
| Paraguayans | 24.8 /100 | #198 | Fair 95.9% |
| Guamanians/Chamorros | 23.5 /100 | #199 | Fair 95.9% |
| Argentineans | 23.2 /100 | #200 | Fair 95.9% |
| Immigrants | Argentina | 21.9 /100 | #201 | Fair 95.9% |
| Immigrants | Northern Africa | 21.4 /100 | #202 | Fair 95.8% |