Immigrants from Portugal vs Malaysian 7th Grade
COMPARE
Immigrants from Portugal
Malaysian
7th Grade
7th Grade Comparison
Immigrants from Portugal
Malaysians
94.2%
7TH GRADE
0.0/ 100
METRIC RATING
307th/ 347
METRIC RANK
94.8%
7TH GRADE
0.0/ 100
METRIC RATING
290th/ 347
METRIC RANK
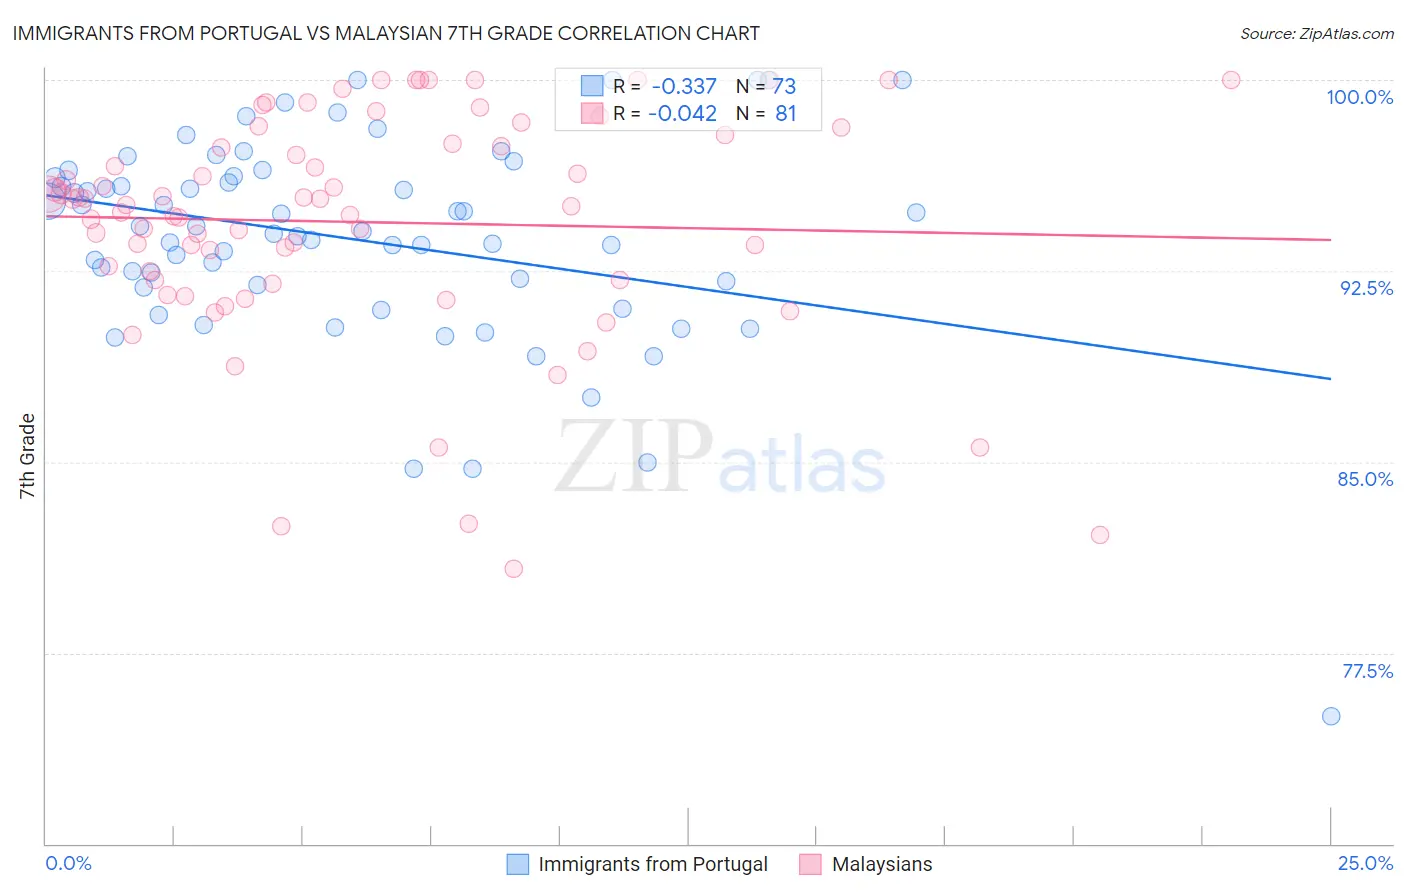
Immigrants from Portugal vs Malaysian 7th Grade Correlation Chart
The statistical analysis conducted on geographies consisting of 174,792,107 people shows a mild negative correlation between the proportion of Immigrants from Portugal and percentage of population with at least 7th grade education in the United States with a correlation coefficient (R) of -0.337 and weighted average of 94.2%. Similarly, the statistical analysis conducted on geographies consisting of 226,107,000 people shows no correlation between the proportion of Malaysians and percentage of population with at least 7th grade education in the United States with a correlation coefficient (R) of -0.042 and weighted average of 94.8%, a difference of 0.68%.
7th Grade Correlation Summary
| Measurement | Immigrants from Portugal | Malaysian |
| Minimum | 75.0% | 80.8% |
| Maximum | 100.0% | 100.0% |
| Range | 25.0% | 19.2% |
| Mean | 93.7% | 94.4% |
| Median | 94.1% | 95.1% |
| Interquartile 25% (IQ1) | 91.9% | 92.1% |
| Interquartile 75% (IQ3) | 96.2% | 97.7% |
| Interquartile Range (IQR) | 4.3% | 5.5% |
| Standard Deviation (Sample) | 4.1% | 4.4% |
| Standard Deviation (Population) | 4.1% | 4.4% |
Demographics Similar to Immigrants from Portugal and Malaysians by 7th Grade
In terms of 7th grade, the demographic groups most similar to Immigrants from Portugal are Immigrants from Guyana (94.2%, a difference of 0.020%), Cape Verdean (94.1%, a difference of 0.080%), Guyanese (94.3%, a difference of 0.15%), Immigrants from Haiti (94.3%, a difference of 0.17%), and Sri Lankan (94.4%, a difference of 0.20%). Similarly, the demographic groups most similar to Malaysians are Taiwanese (94.8%, a difference of 0.020%), British West Indian (94.8%, a difference of 0.030%), Immigrants from Grenada (94.8%, a difference of 0.040%), Immigrants from West Indies (94.8%, a difference of 0.060%), and Fijian (94.7%, a difference of 0.090%).
| Demographics | Rating | Rank | 7th Grade |
| British West Indians | 0.0 /100 | #288 | Tragic 94.8% |
| Taiwanese | 0.0 /100 | #289 | Tragic 94.8% |
| Malaysians | 0.0 /100 | #290 | Tragic 94.8% |
| Immigrants | Grenada | 0.0 /100 | #291 | Tragic 94.8% |
| Immigrants | West Indies | 0.0 /100 | #292 | Tragic 94.8% |
| Fijians | 0.0 /100 | #293 | Tragic 94.7% |
| Haitians | 0.0 /100 | #294 | Tragic 94.7% |
| Yaqui | 0.0 /100 | #295 | Tragic 94.6% |
| Cubans | 0.0 /100 | #296 | Tragic 94.6% |
| Immigrants | South Eastern Asia | 0.0 /100 | #297 | Tragic 94.5% |
| Indonesians | 0.0 /100 | #298 | Tragic 94.5% |
| Bangladeshis | 0.0 /100 | #299 | Tragic 94.5% |
| Immigrants | Burma/Myanmar | 0.0 /100 | #300 | Tragic 94.5% |
| Immigrants | Dominica | 0.0 /100 | #301 | Tragic 94.5% |
| Immigrants | Laos | 0.0 /100 | #302 | Tragic 94.5% |
| Sri Lankans | 0.0 /100 | #303 | Tragic 94.4% |
| Immigrants | Haiti | 0.0 /100 | #304 | Tragic 94.3% |
| Guyanese | 0.0 /100 | #305 | Tragic 94.3% |
| Immigrants | Guyana | 0.0 /100 | #306 | Tragic 94.2% |
| Immigrants | Portugal | 0.0 /100 | #307 | Tragic 94.2% |
| Cape Verdeans | 0.0 /100 | #308 | Tragic 94.1% |