French American Indian vs Native/Alaskan 2nd Grade
COMPARE
French American Indian
Native/Alaskan
2nd Grade
2nd Grade Comparison
French American Indians
Natives/Alaskans
97.9%
2ND GRADE
64.3/ 100
METRIC RATING
155th/ 347
METRIC RANK
97.9%
2ND GRADE
44.3/ 100
METRIC RATING
180th/ 347
METRIC RANK
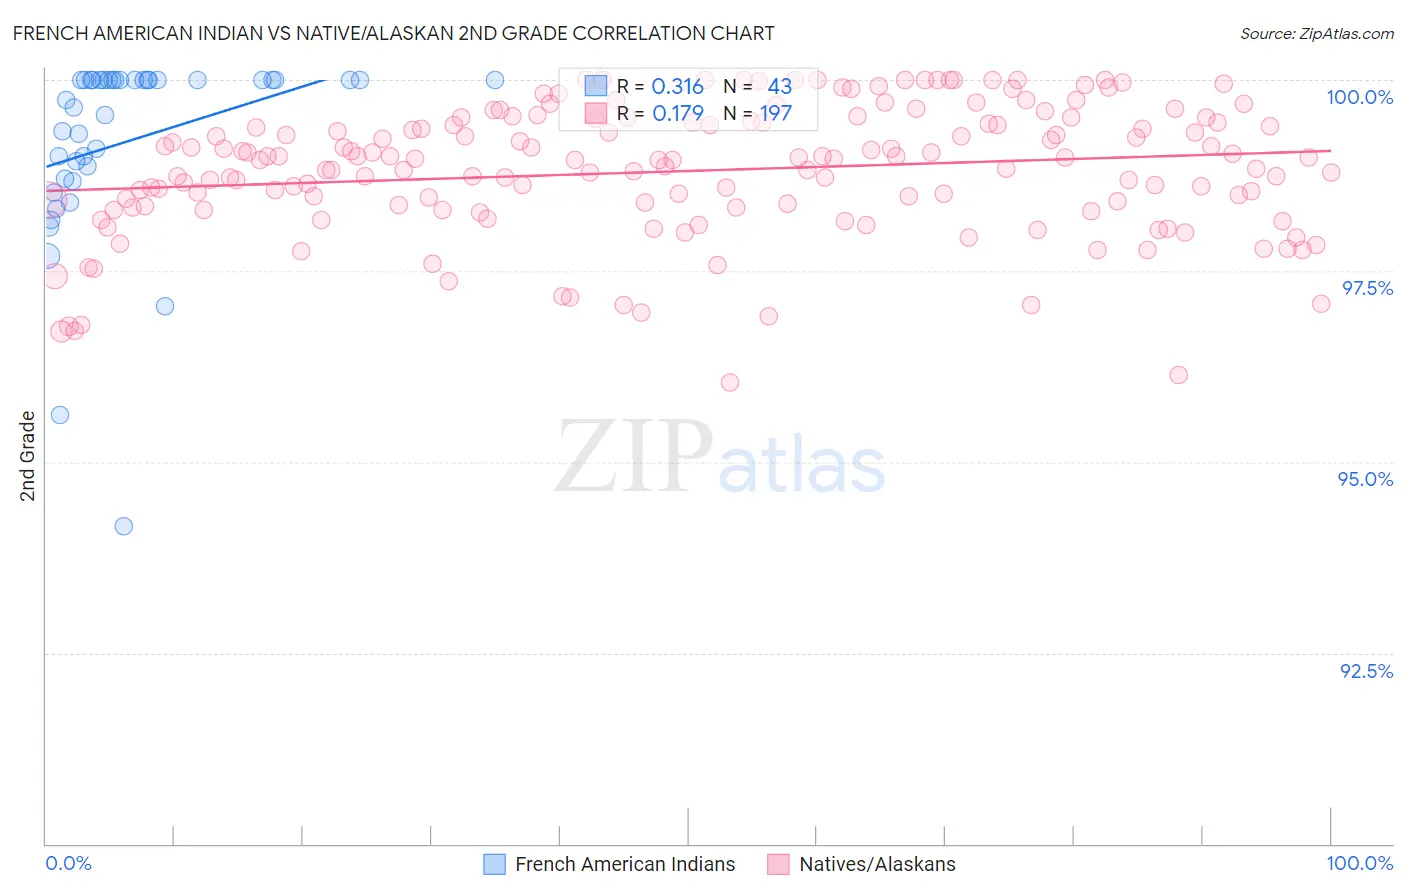
French American Indian vs Native/Alaskan 2nd Grade Correlation Chart
The statistical analysis conducted on geographies consisting of 131,974,854 people shows a mild positive correlation between the proportion of French American Indians and percentage of population with at least 2nd grade education in the United States with a correlation coefficient (R) of 0.316 and weighted average of 97.9%. Similarly, the statistical analysis conducted on geographies consisting of 513,058,987 people shows a poor positive correlation between the proportion of Natives/Alaskans and percentage of population with at least 2nd grade education in the United States with a correlation coefficient (R) of 0.179 and weighted average of 97.9%, a difference of 0.060%.
2nd Grade Correlation Summary
| Measurement | French American Indian | Native/Alaskan |
| Minimum | 94.2% | 96.0% |
| Maximum | 100.0% | 100.0% |
| Range | 5.8% | 4.0% |
| Mean | 99.2% | 98.8% |
| Median | 100.0% | 99.0% |
| Interquartile 25% (IQ1) | 98.7% | 98.3% |
| Interquartile 75% (IQ3) | 100.0% | 99.4% |
| Interquartile Range (IQR) | 1.3% | 1.1% |
| Standard Deviation (Sample) | 1.2% | 0.85% |
| Standard Deviation (Population) | 1.2% | 0.85% |
Similar Demographics by 2nd Grade
Demographics Similar to French American Indians by 2nd Grade
In terms of 2nd grade, the demographic groups most similar to French American Indians are Dutch West Indian (97.9%, a difference of 0.0%), Venezuelan (97.9%, a difference of 0.0%), Immigrants from North Macedonia (97.9%, a difference of 0.010%), Immigrants from South Central Asia (97.9%, a difference of 0.010%), and Marshallese (97.9%, a difference of 0.010%).
| Demographics | Rating | Rank | 2nd Grade |
| Jordanians | 74.5 /100 | #148 | Good 98.0% |
| Apache | 74.0 /100 | #149 | Good 97.9% |
| Immigrants | Moldova | 72.9 /100 | #150 | Good 97.9% |
| Soviet Union | 70.7 /100 | #151 | Good 97.9% |
| Immigrants | North Macedonia | 68.5 /100 | #152 | Good 97.9% |
| Immigrants | South Central Asia | 68.3 /100 | #153 | Good 97.9% |
| Marshallese | 67.7 /100 | #154 | Good 97.9% |
| French American Indians | 64.3 /100 | #155 | Good 97.9% |
| Dutch West Indians | 63.8 /100 | #156 | Good 97.9% |
| Venezuelans | 63.3 /100 | #157 | Good 97.9% |
| Immigrants | Iran | 62.8 /100 | #158 | Good 97.9% |
| Comanche | 62.8 /100 | #159 | Good 97.9% |
| Immigrants | Eastern Europe | 61.1 /100 | #160 | Good 97.9% |
| Immigrants | Russia | 60.3 /100 | #161 | Good 97.9% |
| Immigrants | Italy | 60.2 /100 | #162 | Good 97.9% |
Demographics Similar to Natives/Alaskans by 2nd Grade
In terms of 2nd grade, the demographic groups most similar to Natives/Alaskans are Egyptian (97.9%, a difference of 0.0%), Immigrants from Sri Lanka (97.9%, a difference of 0.010%), Immigrants from Brazil (97.9%, a difference of 0.010%), Argentinean (97.9%, a difference of 0.010%), and Immigrants from Venezuela (97.9%, a difference of 0.010%).
| Demographics | Rating | Rank | 2nd Grade |
| Kenyans | 52.7 /100 | #173 | Average 97.9% |
| Immigrants | Micronesia | 50.0 /100 | #174 | Average 97.9% |
| Immigrants | Bosnia and Herzegovina | 49.8 /100 | #175 | Average 97.9% |
| Immigrants | Sri Lanka | 48.7 /100 | #176 | Average 97.9% |
| Immigrants | Brazil | 46.6 /100 | #177 | Average 97.9% |
| Argentineans | 46.3 /100 | #178 | Average 97.9% |
| Immigrants | Venezuela | 46.1 /100 | #179 | Average 97.9% |
| Natives/Alaskans | 44.3 /100 | #180 | Average 97.9% |
| Egyptians | 44.3 /100 | #181 | Average 97.9% |
| Portuguese | 42.4 /100 | #182 | Average 97.8% |
| Immigrants | Poland | 42.2 /100 | #183 | Average 97.8% |
| Immigrants | Belarus | 41.5 /100 | #184 | Average 97.8% |
| Immigrants | Argentina | 40.6 /100 | #185 | Average 97.8% |
| Arabs | 36.9 /100 | #186 | Fair 97.8% |
| Pakistanis | 36.1 /100 | #187 | Fair 97.8% |