Immigrants from Kenya vs Native/Alaskan 2nd Grade
COMPARE
Immigrants from Kenya
Native/Alaskan
2nd Grade
2nd Grade Comparison
Immigrants from Kenya
Natives/Alaskans
97.8%
2ND GRADE
26.4/ 100
METRIC RATING
196th/ 347
METRIC RANK
97.9%
2ND GRADE
44.3/ 100
METRIC RATING
180th/ 347
METRIC RANK
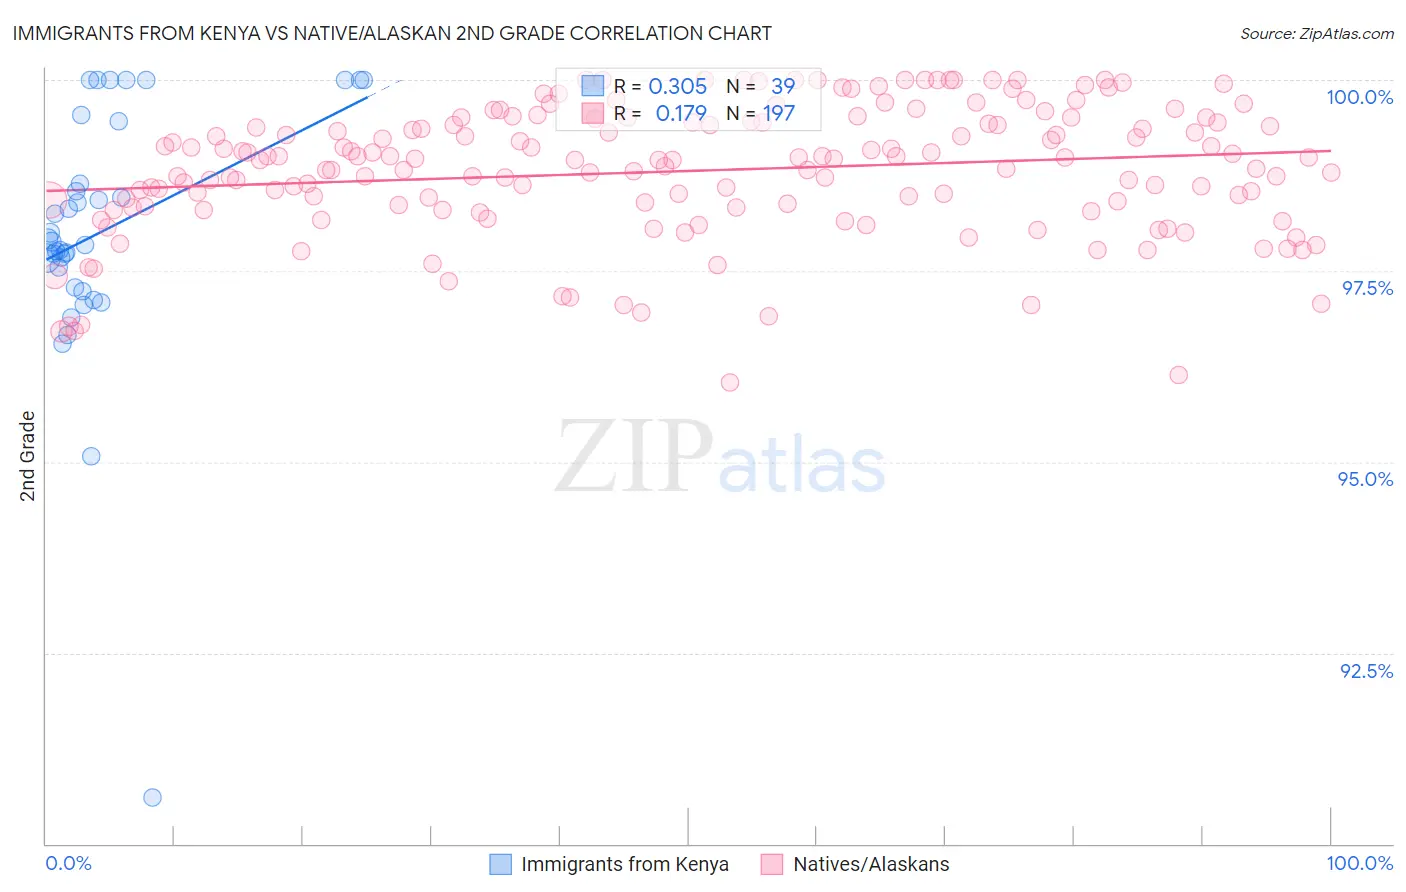
Immigrants from Kenya vs Native/Alaskan 2nd Grade Correlation Chart
The statistical analysis conducted on geographies consisting of 218,076,690 people shows a mild positive correlation between the proportion of Immigrants from Kenya and percentage of population with at least 2nd grade education in the United States with a correlation coefficient (R) of 0.305 and weighted average of 97.8%. Similarly, the statistical analysis conducted on geographies consisting of 513,058,987 people shows a poor positive correlation between the proportion of Natives/Alaskans and percentage of population with at least 2nd grade education in the United States with a correlation coefficient (R) of 0.179 and weighted average of 97.9%, a difference of 0.060%.
2nd Grade Correlation Summary
| Measurement | Immigrants from Kenya | Native/Alaskan |
| Minimum | 90.6% | 96.0% |
| Maximum | 100.0% | 100.0% |
| Range | 9.4% | 4.0% |
| Mean | 98.0% | 98.8% |
| Median | 97.9% | 99.0% |
| Interquartile 25% (IQ1) | 97.3% | 98.3% |
| Interquartile 75% (IQ3) | 99.5% | 99.4% |
| Interquartile Range (IQR) | 2.2% | 1.1% |
| Standard Deviation (Sample) | 1.7% | 0.85% |
| Standard Deviation (Population) | 1.7% | 0.85% |
Demographics Similar to Immigrants from Kenya and Natives/Alaskans by 2nd Grade
In terms of 2nd grade, the demographic groups most similar to Immigrants from Kenya are Paiute (97.8%, a difference of 0.0%), Mongolian (97.8%, a difference of 0.0%), Immigrants from Uganda (97.8%, a difference of 0.0%), Guamanian/Chamorro (97.8%, a difference of 0.0%), and Black/African American (97.8%, a difference of 0.010%). Similarly, the demographic groups most similar to Natives/Alaskans are Egyptian (97.9%, a difference of 0.0%), Argentinean (97.9%, a difference of 0.010%), Immigrants from Venezuela (97.9%, a difference of 0.010%), Portuguese (97.8%, a difference of 0.010%), and Immigrants from Poland (97.8%, a difference of 0.010%).
| Demographics | Rating | Rank | 2nd Grade |
| Argentineans | 46.3 /100 | #178 | Average 97.9% |
| Immigrants | Venezuela | 46.1 /100 | #179 | Average 97.9% |
| Natives/Alaskans | 44.3 /100 | #180 | Average 97.9% |
| Egyptians | 44.3 /100 | #181 | Average 97.9% |
| Portuguese | 42.4 /100 | #182 | Average 97.8% |
| Immigrants | Poland | 42.2 /100 | #183 | Average 97.8% |
| Immigrants | Belarus | 41.5 /100 | #184 | Average 97.8% |
| Immigrants | Argentina | 40.6 /100 | #185 | Average 97.8% |
| Arabs | 36.9 /100 | #186 | Fair 97.8% |
| Pakistanis | 36.1 /100 | #187 | Fair 97.8% |
| Immigrants | Kazakhstan | 35.6 /100 | #188 | Fair 97.8% |
| Panamanians | 33.5 /100 | #189 | Fair 97.8% |
| Immigrants | Taiwan | 31.8 /100 | #190 | Fair 97.8% |
| Paraguayans | 30.8 /100 | #191 | Fair 97.8% |
| Blacks/African Americans | 29.9 /100 | #192 | Fair 97.8% |
| Hawaiians | 28.5 /100 | #193 | Fair 97.8% |
| Paiute | 27.0 /100 | #194 | Fair 97.8% |
| Mongolians | 26.7 /100 | #195 | Fair 97.8% |
| Immigrants | Kenya | 26.4 /100 | #196 | Fair 97.8% |
| Immigrants | Uganda | 26.3 /100 | #197 | Fair 97.8% |
| Guamanians/Chamorros | 25.7 /100 | #198 | Fair 97.8% |