Cheyenne vs Native/Alaskan 2nd Grade
COMPARE
Cheyenne
Native/Alaskan
2nd Grade
2nd Grade Comparison
Cheyenne
Natives/Alaskans
98.3%
2ND GRADE
99.6/ 100
METRIC RATING
72nd/ 347
METRIC RANK
97.9%
2ND GRADE
44.3/ 100
METRIC RATING
180th/ 347
METRIC RANK
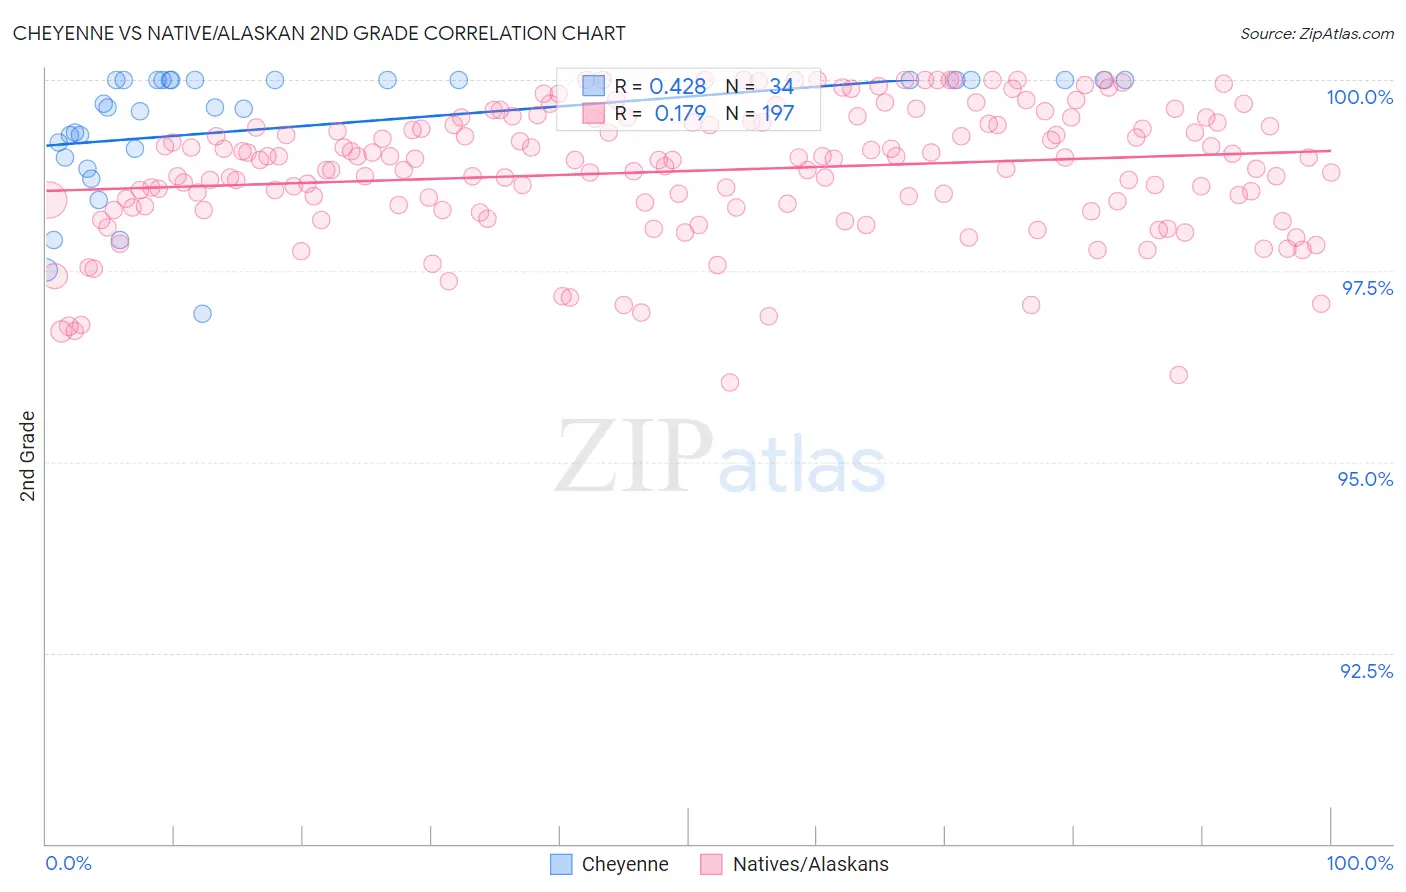
Cheyenne vs Native/Alaskan 2nd Grade Correlation Chart
The statistical analysis conducted on geographies consisting of 80,719,411 people shows a moderate positive correlation between the proportion of Cheyenne and percentage of population with at least 2nd grade education in the United States with a correlation coefficient (R) of 0.428 and weighted average of 98.3%. Similarly, the statistical analysis conducted on geographies consisting of 513,058,987 people shows a poor positive correlation between the proportion of Natives/Alaskans and percentage of population with at least 2nd grade education in the United States with a correlation coefficient (R) of 0.179 and weighted average of 97.9%, a difference of 0.44%.
2nd Grade Correlation Summary
| Measurement | Cheyenne | Native/Alaskan |
| Minimum | 96.9% | 96.0% |
| Maximum | 100.0% | 100.0% |
| Range | 3.1% | 4.0% |
| Mean | 99.4% | 98.8% |
| Median | 99.7% | 99.0% |
| Interquartile 25% (IQ1) | 99.1% | 98.3% |
| Interquartile 75% (IQ3) | 100.0% | 99.4% |
| Interquartile Range (IQR) | 0.90% | 1.1% |
| Standard Deviation (Sample) | 0.82% | 0.85% |
| Standard Deviation (Population) | 0.81% | 0.85% |
Similar Demographics by 2nd Grade
Demographics Similar to Cheyenne by 2nd Grade
In terms of 2nd grade, the demographic groups most similar to Cheyenne are Cajun (98.3%, a difference of 0.0%), Chickasaw (98.3%, a difference of 0.010%), Canadian (98.3%, a difference of 0.020%), Immigrants from Northern Europe (98.3%, a difference of 0.020%), and Russian (98.3%, a difference of 0.020%).
| Demographics | Rating | Rank | 2nd Grade |
| New Zealanders | 99.7 /100 | #65 | Exceptional 98.3% |
| Canadians | 99.7 /100 | #66 | Exceptional 98.3% |
| Immigrants | Northern Europe | 99.7 /100 | #67 | Exceptional 98.3% |
| Russians | 99.7 /100 | #68 | Exceptional 98.3% |
| Immigrants | Austria | 99.6 /100 | #69 | Exceptional 98.3% |
| Serbians | 99.6 /100 | #70 | Exceptional 98.3% |
| Chickasaw | 99.6 /100 | #71 | Exceptional 98.3% |
| Cheyenne | 99.6 /100 | #72 | Exceptional 98.3% |
| Cajuns | 99.5 /100 | #73 | Exceptional 98.3% |
| Immigrants | Netherlands | 99.4 /100 | #74 | Exceptional 98.3% |
| Shoshone | 99.4 /100 | #75 | Exceptional 98.3% |
| Cherokee | 99.4 /100 | #76 | Exceptional 98.3% |
| Immigrants | England | 99.4 /100 | #77 | Exceptional 98.3% |
| Immigrants | Lithuania | 99.3 /100 | #78 | Exceptional 98.2% |
| Immigrants | Belgium | 99.3 /100 | #79 | Exceptional 98.2% |
Demographics Similar to Natives/Alaskans by 2nd Grade
In terms of 2nd grade, the demographic groups most similar to Natives/Alaskans are Egyptian (97.9%, a difference of 0.0%), Immigrants from Sri Lanka (97.9%, a difference of 0.010%), Immigrants from Brazil (97.9%, a difference of 0.010%), Argentinean (97.9%, a difference of 0.010%), and Immigrants from Venezuela (97.9%, a difference of 0.010%).
| Demographics | Rating | Rank | 2nd Grade |
| Kenyans | 52.7 /100 | #173 | Average 97.9% |
| Immigrants | Micronesia | 50.0 /100 | #174 | Average 97.9% |
| Immigrants | Bosnia and Herzegovina | 49.8 /100 | #175 | Average 97.9% |
| Immigrants | Sri Lanka | 48.7 /100 | #176 | Average 97.9% |
| Immigrants | Brazil | 46.6 /100 | #177 | Average 97.9% |
| Argentineans | 46.3 /100 | #178 | Average 97.9% |
| Immigrants | Venezuela | 46.1 /100 | #179 | Average 97.9% |
| Natives/Alaskans | 44.3 /100 | #180 | Average 97.9% |
| Egyptians | 44.3 /100 | #181 | Average 97.9% |
| Portuguese | 42.4 /100 | #182 | Average 97.8% |
| Immigrants | Poland | 42.2 /100 | #183 | Average 97.8% |
| Immigrants | Belarus | 41.5 /100 | #184 | Average 97.8% |
| Immigrants | Argentina | 40.6 /100 | #185 | Average 97.8% |
| Arabs | 36.9 /100 | #186 | Fair 97.8% |
| Pakistanis | 36.1 /100 | #187 | Fair 97.8% |