French American Indian vs French Canadian 2nd Grade
COMPARE
French American Indian
French Canadian
2nd Grade
2nd Grade Comparison
French American Indians
French Canadians
97.9%
2ND GRADE
64.3/ 100
METRIC RATING
155th/ 347
METRIC RANK
98.5%
2ND GRADE
100.0/ 100
METRIC RATING
32nd/ 347
METRIC RANK
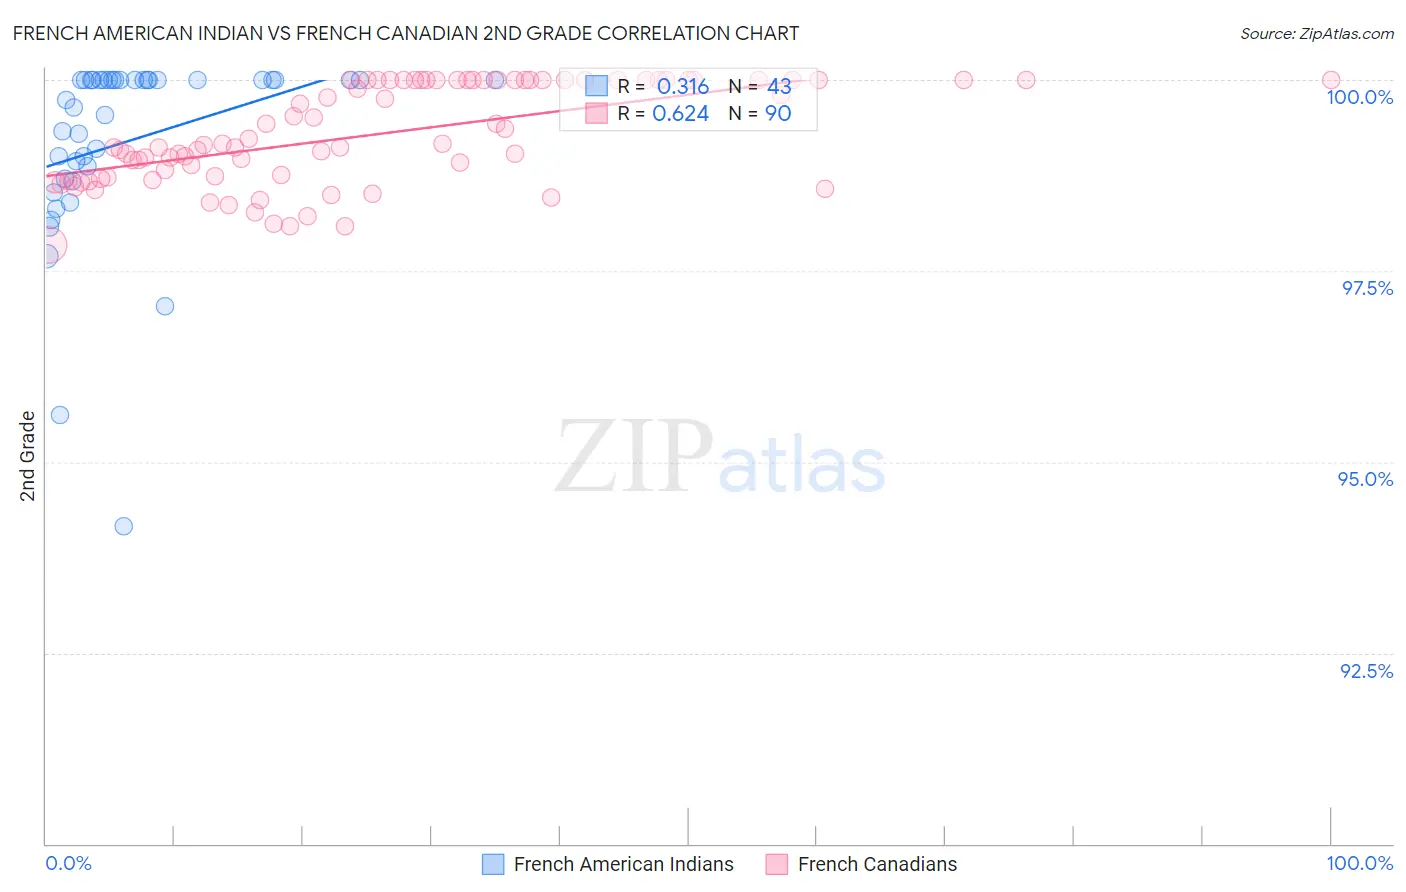
French American Indian vs French Canadian 2nd Grade Correlation Chart
The statistical analysis conducted on geographies consisting of 131,974,854 people shows a mild positive correlation between the proportion of French American Indians and percentage of population with at least 2nd grade education in the United States with a correlation coefficient (R) of 0.316 and weighted average of 97.9%. Similarly, the statistical analysis conducted on geographies consisting of 502,680,064 people shows a significant positive correlation between the proportion of French Canadians and percentage of population with at least 2nd grade education in the United States with a correlation coefficient (R) of 0.624 and weighted average of 98.5%, a difference of 0.61%.
2nd Grade Correlation Summary
| Measurement | French American Indian | French Canadian |
| Minimum | 94.2% | 97.8% |
| Maximum | 100.0% | 100.0% |
| Range | 5.8% | 2.2% |
| Mean | 99.2% | 99.3% |
| Median | 100.0% | 99.2% |
| Interquartile 25% (IQ1) | 98.7% | 98.7% |
| Interquartile 75% (IQ3) | 100.0% | 100.0% |
| Interquartile Range (IQR) | 1.3% | 1.3% |
| Standard Deviation (Sample) | 1.2% | 0.65% |
| Standard Deviation (Population) | 1.2% | 0.64% |
Similar Demographics by 2nd Grade
Demographics Similar to French American Indians by 2nd Grade
In terms of 2nd grade, the demographic groups most similar to French American Indians are Dutch West Indian (97.9%, a difference of 0.0%), Venezuelan (97.9%, a difference of 0.0%), Immigrants from North Macedonia (97.9%, a difference of 0.010%), Immigrants from South Central Asia (97.9%, a difference of 0.010%), and Marshallese (97.9%, a difference of 0.010%).
| Demographics | Rating | Rank | 2nd Grade |
| Jordanians | 74.5 /100 | #148 | Good 98.0% |
| Apache | 74.0 /100 | #149 | Good 97.9% |
| Immigrants | Moldova | 72.9 /100 | #150 | Good 97.9% |
| Soviet Union | 70.7 /100 | #151 | Good 97.9% |
| Immigrants | North Macedonia | 68.5 /100 | #152 | Good 97.9% |
| Immigrants | South Central Asia | 68.3 /100 | #153 | Good 97.9% |
| Marshallese | 67.7 /100 | #154 | Good 97.9% |
| French American Indians | 64.3 /100 | #155 | Good 97.9% |
| Dutch West Indians | 63.8 /100 | #156 | Good 97.9% |
| Venezuelans | 63.3 /100 | #157 | Good 97.9% |
| Immigrants | Iran | 62.8 /100 | #158 | Good 97.9% |
| Comanche | 62.8 /100 | #159 | Good 97.9% |
| Immigrants | Eastern Europe | 61.1 /100 | #160 | Good 97.9% |
| Immigrants | Russia | 60.3 /100 | #161 | Good 97.9% |
| Immigrants | Italy | 60.2 /100 | #162 | Good 97.9% |
Demographics Similar to French Canadians by 2nd Grade
In terms of 2nd grade, the demographic groups most similar to French Canadians are European (98.5%, a difference of 0.0%), Czech (98.5%, a difference of 0.0%), Scandinavian (98.5%, a difference of 0.0%), Arapaho (98.5%, a difference of 0.010%), and French (98.5%, a difference of 0.010%).
| Demographics | Rating | Rank | 2nd Grade |
| Scotch-Irish | 100.0 /100 | #25 | Exceptional 98.5% |
| Welsh | 100.0 /100 | #26 | Exceptional 98.5% |
| Croatians | 100.0 /100 | #27 | Exceptional 98.5% |
| Arapaho | 100.0 /100 | #28 | Exceptional 98.5% |
| French | 100.0 /100 | #29 | Exceptional 98.5% |
| Europeans | 100.0 /100 | #30 | Exceptional 98.5% |
| Czechs | 100.0 /100 | #31 | Exceptional 98.5% |
| French Canadians | 100.0 /100 | #32 | Exceptional 98.5% |
| Scandinavians | 100.0 /100 | #33 | Exceptional 98.5% |
| Chinese | 100.0 /100 | #34 | Exceptional 98.5% |
| Swiss | 100.0 /100 | #35 | Exceptional 98.5% |
| British | 100.0 /100 | #36 | Exceptional 98.5% |
| Italians | 99.9 /100 | #37 | Exceptional 98.4% |
| Latvians | 99.9 /100 | #38 | Exceptional 98.4% |
| Chippewa | 99.9 /100 | #39 | Exceptional 98.4% |