French American Indian vs Immigrants from Kuwait 2nd Grade
COMPARE
French American Indian
Immigrants from Kuwait
2nd Grade
2nd Grade Comparison
French American Indians
Immigrants from Kuwait
97.9%
2ND GRADE
64.3/ 100
METRIC RATING
155th/ 347
METRIC RANK
98.0%
2ND GRADE
89.2/ 100
METRIC RATING
136th/ 347
METRIC RANK
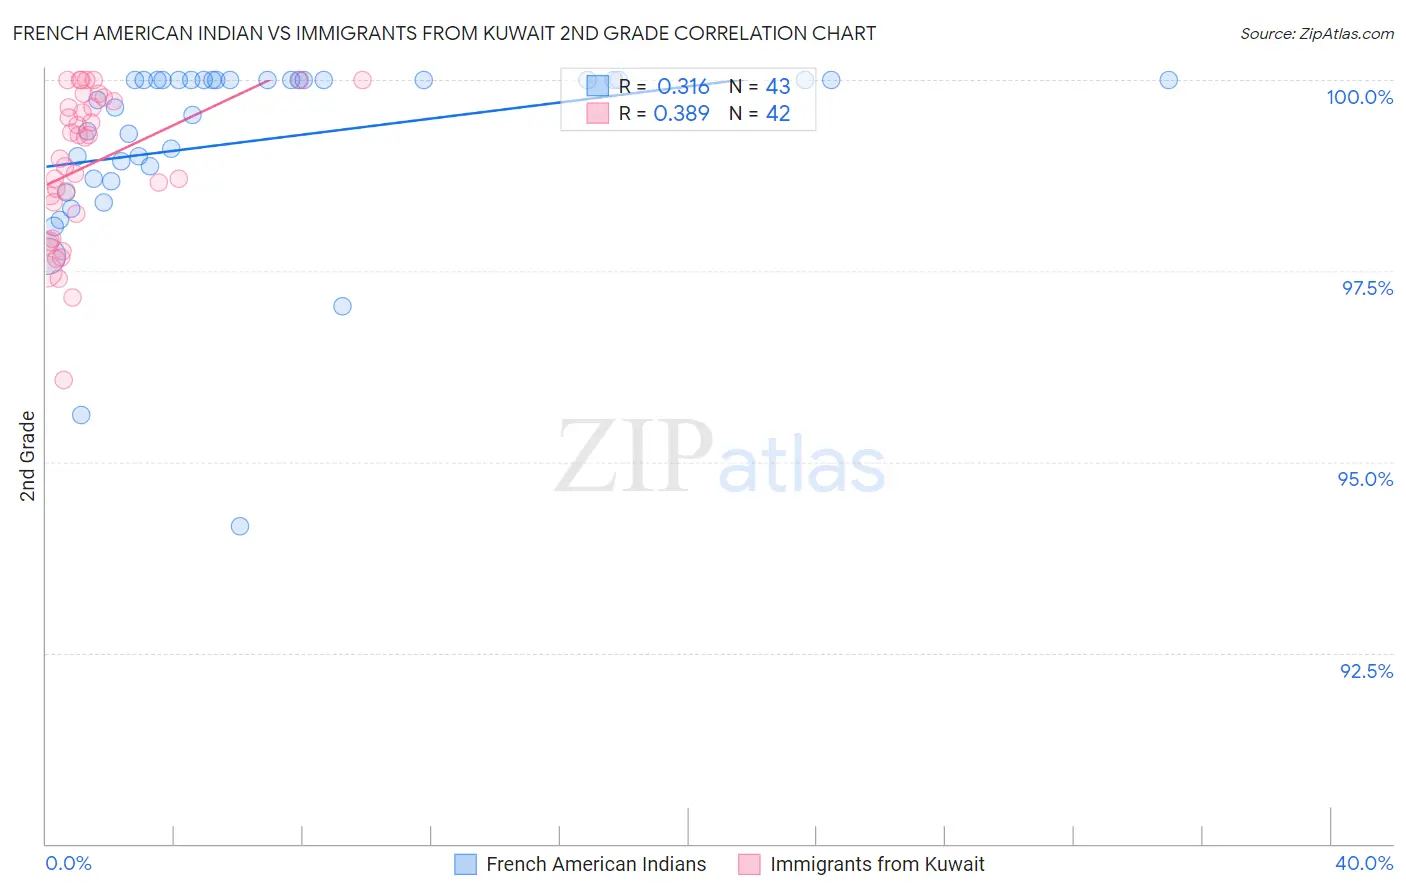
French American Indian vs Immigrants from Kuwait 2nd Grade Correlation Chart
The statistical analysis conducted on geographies consisting of 131,974,854 people shows a mild positive correlation between the proportion of French American Indians and percentage of population with at least 2nd grade education in the United States with a correlation coefficient (R) of 0.316 and weighted average of 97.9%. Similarly, the statistical analysis conducted on geographies consisting of 136,913,666 people shows a mild positive correlation between the proportion of Immigrants from Kuwait and percentage of population with at least 2nd grade education in the United States with a correlation coefficient (R) of 0.389 and weighted average of 98.0%, a difference of 0.12%.
2nd Grade Correlation Summary
| Measurement | French American Indian | Immigrants from Kuwait |
| Minimum | 94.2% | 96.1% |
| Maximum | 100.0% | 100.0% |
| Range | 5.8% | 3.9% |
| Mean | 99.2% | 98.9% |
| Median | 100.0% | 99.1% |
| Interquartile 25% (IQ1) | 98.7% | 98.2% |
| Interquartile 75% (IQ3) | 100.0% | 99.7% |
| Interquartile Range (IQR) | 1.3% | 1.5% |
| Standard Deviation (Sample) | 1.2% | 0.97% |
| Standard Deviation (Population) | 1.2% | 0.96% |
Demographics Similar to French American Indians and Immigrants from Kuwait by 2nd Grade
In terms of 2nd grade, the demographic groups most similar to French American Indians are Immigrants from North Macedonia (97.9%, a difference of 0.010%), Immigrants from South Central Asia (97.9%, a difference of 0.010%), Marshallese (97.9%, a difference of 0.010%), Soviet Union (97.9%, a difference of 0.020%), and Immigrants from Moldova (97.9%, a difference of 0.030%). Similarly, the demographic groups most similar to Immigrants from Kuwait are Immigrants from Bulgaria (98.0%, a difference of 0.0%), Immigrants from Romania (98.0%, a difference of 0.010%), Israeli (98.0%, a difference of 0.010%), Blackfeet (98.0%, a difference of 0.010%), and Palestinian (98.0%, a difference of 0.040%).
| Demographics | Rating | Rank | 2nd Grade |
| Immigrants | Bulgaria | 89.7 /100 | #135 | Excellent 98.0% |
| Immigrants | Kuwait | 89.2 /100 | #136 | Excellent 98.0% |
| Immigrants | Romania | 88.3 /100 | #137 | Excellent 98.0% |
| Israelis | 87.9 /100 | #138 | Excellent 98.0% |
| Blackfeet | 87.5 /100 | #139 | Excellent 98.0% |
| Palestinians | 83.9 /100 | #140 | Excellent 98.0% |
| Immigrants | Turkey | 83.0 /100 | #141 | Excellent 98.0% |
| Burmese | 81.0 /100 | #142 | Excellent 98.0% |
| Alsatians | 80.5 /100 | #143 | Excellent 98.0% |
| Hmong | 80.0 /100 | #144 | Good 98.0% |
| Filipinos | 79.2 /100 | #145 | Good 98.0% |
| Immigrants | Israel | 78.0 /100 | #146 | Good 98.0% |
| Immigrants | Greece | 76.8 /100 | #147 | Good 98.0% |
| Jordanians | 74.5 /100 | #148 | Good 98.0% |
| Apache | 74.0 /100 | #149 | Good 97.9% |
| Immigrants | Moldova | 72.9 /100 | #150 | Good 97.9% |
| Soviet Union | 70.7 /100 | #151 | Good 97.9% |
| Immigrants | North Macedonia | 68.5 /100 | #152 | Good 97.9% |
| Immigrants | South Central Asia | 68.3 /100 | #153 | Good 97.9% |
| Marshallese | 67.7 /100 | #154 | Good 97.9% |
| French American Indians | 64.3 /100 | #155 | Good 97.9% |