French American Indian vs Immigrants from Africa Kindergarten
COMPARE
French American Indian
Immigrants from Africa
Kindergarten
Kindergarten Comparison
French American Indians
Immigrants from Africa
98.0%
KINDERGARTEN
63.7/ 100
METRIC RATING
159th/ 347
METRIC RANK
97.6%
KINDERGARTEN
0.8/ 100
METRIC RATING
253rd/ 347
METRIC RANK
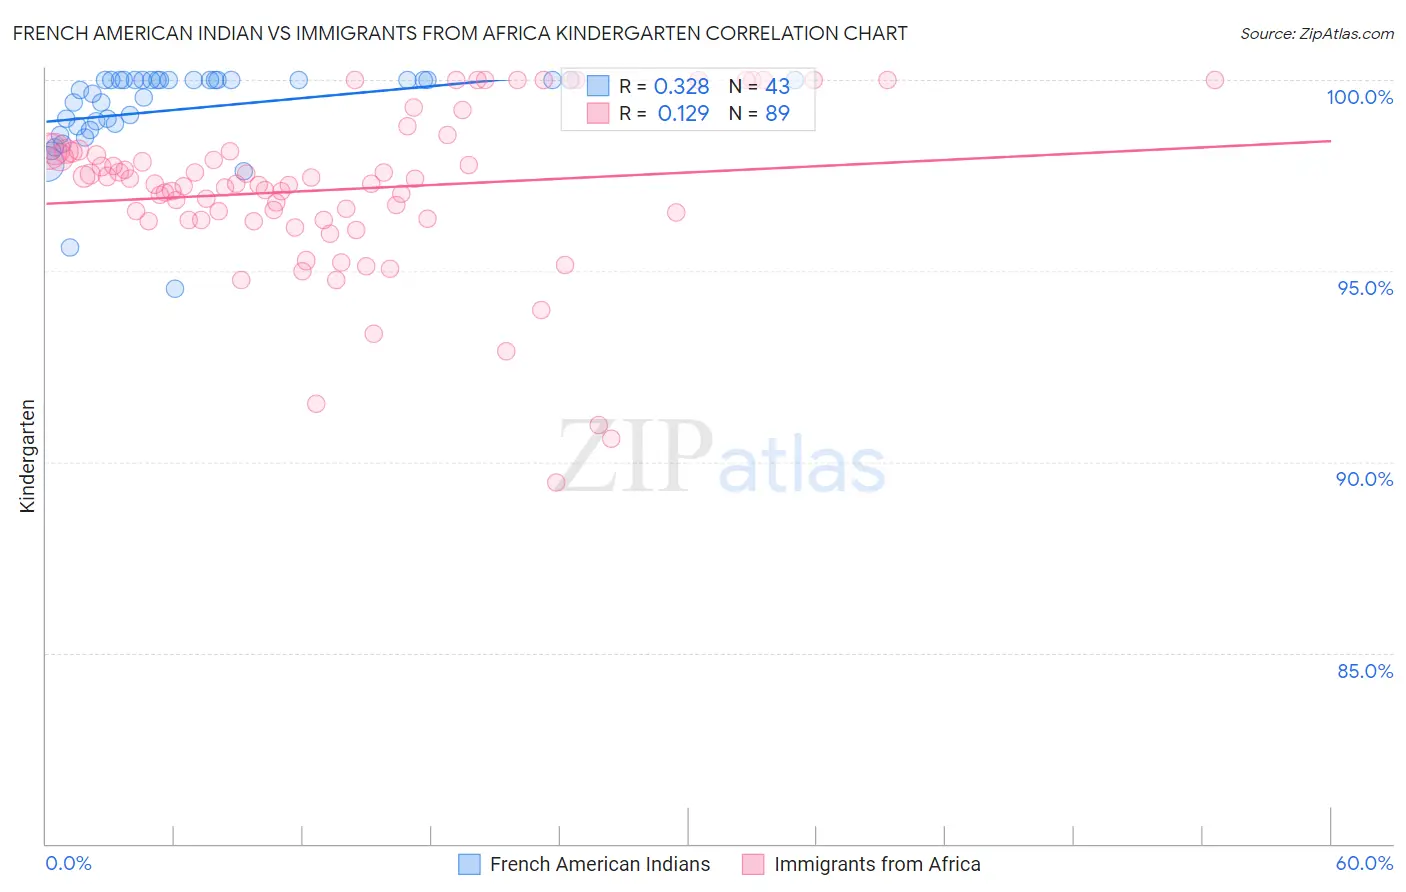
French American Indian vs Immigrants from Africa Kindergarten Correlation Chart
The statistical analysis conducted on geographies consisting of 131,974,854 people shows a mild positive correlation between the proportion of French American Indians and percentage of population with at least kindergarten education in the United States with a correlation coefficient (R) of 0.328 and weighted average of 98.0%. Similarly, the statistical analysis conducted on geographies consisting of 469,440,174 people shows a poor positive correlation between the proportion of Immigrants from Africa and percentage of population with at least kindergarten education in the United States with a correlation coefficient (R) of 0.129 and weighted average of 97.6%, a difference of 0.41%.
Kindergarten Correlation Summary
| Measurement | French American Indian | Immigrants from Africa |
| Minimum | 94.5% | 89.5% |
| Maximum | 100.0% | 100.0% |
| Range | 5.5% | 10.5% |
| Mean | 99.2% | 97.1% |
| Median | 100.0% | 97.3% |
| Interquartile 25% (IQ1) | 98.8% | 96.3% |
| Interquartile 75% (IQ3) | 100.0% | 98.1% |
| Interquartile Range (IQR) | 1.2% | 1.8% |
| Standard Deviation (Sample) | 1.2% | 2.1% |
| Standard Deviation (Population) | 1.2% | 2.1% |
Similar Demographics by Kindergarten
Demographics Similar to French American Indians by Kindergarten
In terms of kindergarten, the demographic groups most similar to French American Indians are Venezuelan (98.0%, a difference of 0.0%), Immigrants from South Central Asia (98.0%, a difference of 0.010%), Immigrants from North Macedonia (98.0%, a difference of 0.010%), Dutch West Indian (98.0%, a difference of 0.020%), and Immigrants from Moldova (98.0%, a difference of 0.020%).
| Demographics | Rating | Rank | Kindergarten |
| Dutch West Indians | 70.1 /100 | #152 | Good 98.0% |
| Immigrants | Moldova | 69.1 /100 | #153 | Good 98.0% |
| Immigrants | Iran | 68.8 /100 | #154 | Good 98.0% |
| Comanche | 68.3 /100 | #155 | Good 98.0% |
| Immigrants | South Central Asia | 66.6 /100 | #156 | Good 98.0% |
| Immigrants | North Macedonia | 66.4 /100 | #157 | Good 98.0% |
| Venezuelans | 64.7 /100 | #158 | Good 98.0% |
| French American Indians | 63.7 /100 | #159 | Good 98.0% |
| Immigrants | Russia | 59.0 /100 | #160 | Average 98.0% |
| Immigrants | Eastern Europe | 59.0 /100 | #161 | Average 98.0% |
| Immigrants | Italy | 58.9 /100 | #162 | Average 98.0% |
| Spanish Americans | 57.8 /100 | #163 | Average 98.0% |
| Immigrants | Micronesia | 57.7 /100 | #164 | Average 98.0% |
| Ugandans | 56.9 /100 | #165 | Average 98.0% |
| Chileans | 56.3 /100 | #166 | Average 98.0% |
Demographics Similar to Immigrants from Africa by Kindergarten
In terms of kindergarten, the demographic groups most similar to Immigrants from Africa are Immigrants from Iraq (97.6%, a difference of 0.0%), Immigrants from Middle Africa (97.6%, a difference of 0.010%), Peruvian (97.6%, a difference of 0.010%), Immigrants from Senegal (97.6%, a difference of 0.010%), and Ethiopian (97.6%, a difference of 0.010%).
| Demographics | Rating | Rank | Kindergarten |
| Indians (Asian) | 1.0 /100 | #246 | Tragic 97.6% |
| Immigrants | Eastern Africa | 1.0 /100 | #247 | Tragic 97.6% |
| Immigrants | Middle Africa | 1.0 /100 | #248 | Tragic 97.6% |
| Peruvians | 1.0 /100 | #249 | Tragic 97.6% |
| Immigrants | Senegal | 0.9 /100 | #250 | Tragic 97.6% |
| Ethiopians | 0.9 /100 | #251 | Tragic 97.6% |
| Immigrants | Iraq | 0.9 /100 | #252 | Tragic 97.6% |
| Immigrants | Africa | 0.8 /100 | #253 | Tragic 97.6% |
| Immigrants | Asia | 0.8 /100 | #254 | Tragic 97.6% |
| Immigrants | Congo | 0.8 /100 | #255 | Tragic 97.6% |
| Yaqui | 0.7 /100 | #256 | Tragic 97.6% |
| Immigrants | Colombia | 0.6 /100 | #257 | Tragic 97.6% |
| Jamaicans | 0.6 /100 | #258 | Tragic 97.6% |
| Armenians | 0.5 /100 | #259 | Tragic 97.6% |
| Fijians | 0.5 /100 | #260 | Tragic 97.5% |