French American Indian vs Immigrants from Africa Unemployment Among Ages 45 to 54 years
COMPARE
French American Indian
Immigrants from Africa
Unemployment Among Ages 45 to 54 years
Unemployment Among Ages 45 to 54 years Comparison
French American Indians
Immigrants from Africa
5.0%
UNEMPLOYMENT AMONG AGES 45 TO 54 YEARS
0.0/ 100
METRIC RATING
276th/ 347
METRIC RANK
4.6%
UNEMPLOYMENT AMONG AGES 45 TO 54 YEARS
13.6/ 100
METRIC RATING
208th/ 347
METRIC RANK
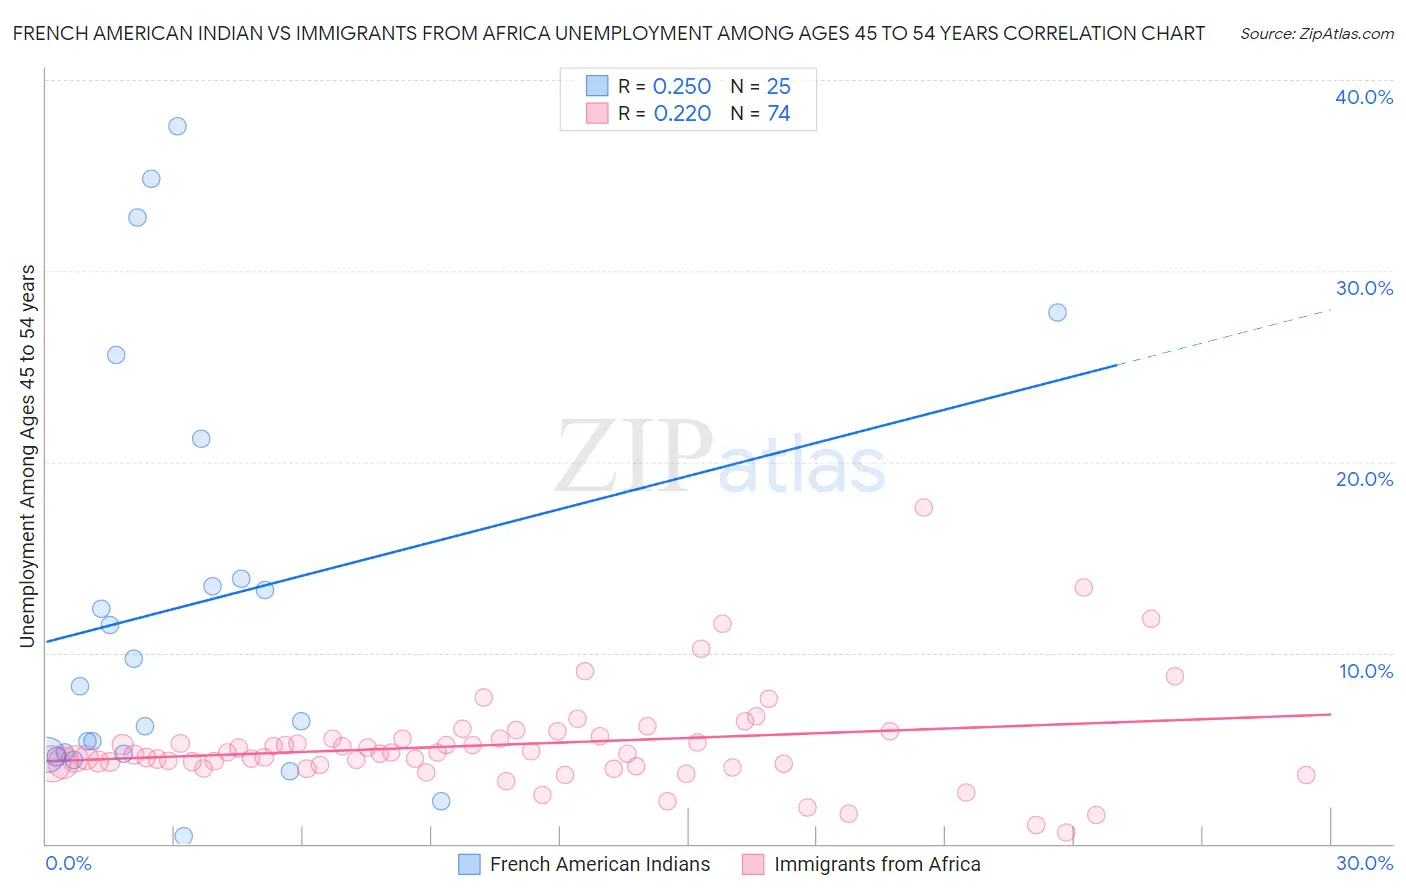
French American Indian vs Immigrants from Africa Unemployment Among Ages 45 to 54 years Correlation Chart
The statistical analysis conducted on geographies consisting of 129,983,277 people shows a weak positive correlation between the proportion of French American Indians and unemployment rate among population between the ages 45 and 54 in the United States with a correlation coefficient (R) of 0.250 and weighted average of 5.0%. Similarly, the statistical analysis conducted on geographies consisting of 453,953,289 people shows a weak positive correlation between the proportion of Immigrants from Africa and unemployment rate among population between the ages 45 and 54 in the United States with a correlation coefficient (R) of 0.220 and weighted average of 4.6%, a difference of 8.7%.
Unemployment Among Ages 45 to 54 years Correlation Summary
| Measurement | French American Indian | Immigrants from Africa |
| Minimum | 0.40% | 0.60% |
| Maximum | 37.6% | 17.6% |
| Range | 37.2% | 17.0% |
| Mean | 12.6% | 5.2% |
| Median | 8.2% | 4.7% |
| Interquartile 25% (IQ1) | 4.7% | 4.1% |
| Interquartile 75% (IQ3) | 17.5% | 5.5% |
| Interquartile Range (IQR) | 12.9% | 1.4% |
| Standard Deviation (Sample) | 10.9% | 2.6% |
| Standard Deviation (Population) | 10.7% | 2.6% |
Similar Demographics by Unemployment Among Ages 45 to 54 years
Demographics Similar to French American Indians by Unemployment Among Ages 45 to 54 years
In terms of unemployment among ages 45 to 54 years, the demographic groups most similar to French American Indians are Immigrants from Mexico (5.0%, a difference of 0.13%), Dutch West Indian (5.0%, a difference of 0.33%), Nepalese (5.0%, a difference of 0.47%), Bermudan (5.0%, a difference of 0.61%), and U.S. Virgin Islander (5.0%, a difference of 0.66%).
| Demographics | Rating | Rank | Unemployment Among Ages 45 to 54 years |
| Somalis | 0.0 /100 | #269 | Tragic 5.0% |
| Immigrants | Ghana | 0.0 /100 | #270 | Tragic 5.0% |
| Cajuns | 0.0 /100 | #271 | Tragic 5.0% |
| Immigrants | Central America | 0.0 /100 | #272 | Tragic 5.0% |
| Immigrants | Latin America | 0.0 /100 | #273 | Tragic 5.0% |
| U.S. Virgin Islanders | 0.0 /100 | #274 | Tragic 5.0% |
| Bermudans | 0.0 /100 | #275 | Tragic 5.0% |
| French American Indians | 0.0 /100 | #276 | Tragic 5.0% |
| Immigrants | Mexico | 0.0 /100 | #277 | Tragic 5.0% |
| Dutch West Indians | 0.0 /100 | #278 | Tragic 5.0% |
| Nepalese | 0.0 /100 | #279 | Tragic 5.0% |
| Blackfeet | 0.0 /100 | #280 | Tragic 5.1% |
| Spanish American Indians | 0.0 /100 | #281 | Tragic 5.1% |
| Africans | 0.0 /100 | #282 | Tragic 5.1% |
| Hispanics or Latinos | 0.0 /100 | #283 | Tragic 5.1% |
Demographics Similar to Immigrants from Africa by Unemployment Among Ages 45 to 54 years
In terms of unemployment among ages 45 to 54 years, the demographic groups most similar to Immigrants from Africa are Arab (4.6%, a difference of 0.020%), Immigrants from Nigeria (4.6%, a difference of 0.030%), Immigrants from Switzerland (4.6%, a difference of 0.050%), Immigrants from South America (4.6%, a difference of 0.14%), and Creek (4.6%, a difference of 0.17%).
| Demographics | Rating | Rank | Unemployment Among Ages 45 to 54 years |
| Immigrants | Costa Rica | 19.7 /100 | #201 | Poor 4.6% |
| Immigrants | Peru | 19.1 /100 | #202 | Poor 4.6% |
| Liberians | 18.7 /100 | #203 | Poor 4.6% |
| Immigrants | Morocco | 16.8 /100 | #204 | Poor 4.6% |
| Immigrants | Greece | 16.2 /100 | #205 | Poor 4.6% |
| Immigrants | Switzerland | 14.0 /100 | #206 | Poor 4.6% |
| Arabs | 13.7 /100 | #207 | Poor 4.6% |
| Immigrants | Africa | 13.6 /100 | #208 | Poor 4.6% |
| Immigrants | Nigeria | 13.3 /100 | #209 | Poor 4.6% |
| Immigrants | South America | 12.2 /100 | #210 | Poor 4.6% |
| Creek | 11.9 /100 | #211 | Poor 4.6% |
| Immigrants | Iran | 11.5 /100 | #212 | Poor 4.6% |
| Panamanians | 10.7 /100 | #213 | Poor 4.6% |
| Cherokee | 10.6 /100 | #214 | Poor 4.6% |
| Immigrants | Panama | 10.4 /100 | #215 | Poor 4.6% |