French American Indian vs Kenyan Doctorate Degree
COMPARE
French American Indian
Kenyan
Doctorate Degree
Doctorate Degree Comparison
French American Indians
Kenyans
1.6%
DOCTORATE DEGREE
2.0/ 100
METRIC RATING
244th/ 347
METRIC RANK
1.9%
DOCTORATE DEGREE
83.6/ 100
METRIC RATING
145th/ 347
METRIC RANK
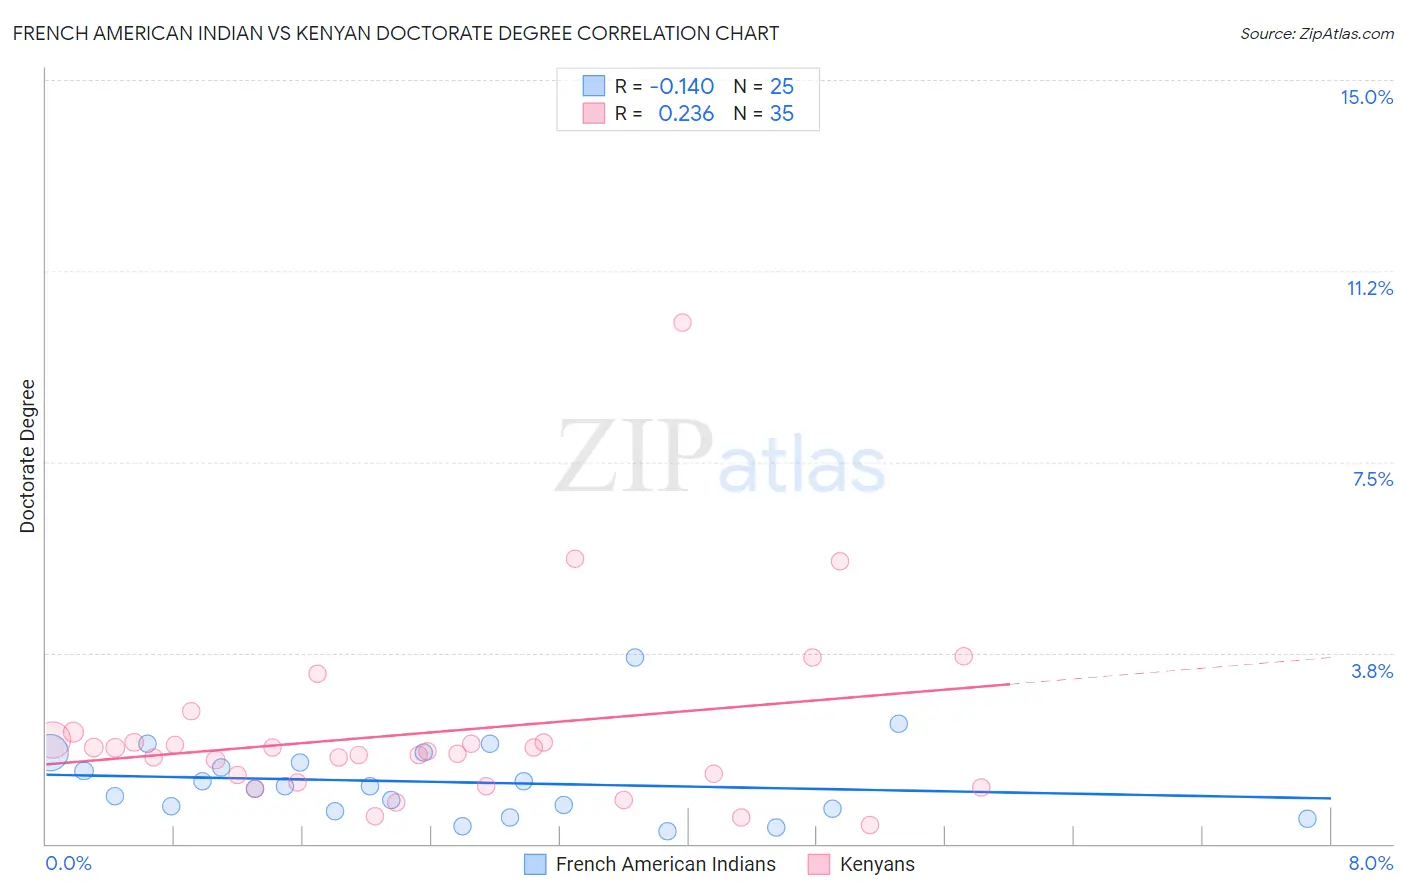
French American Indian vs Kenyan Doctorate Degree Correlation Chart
The statistical analysis conducted on geographies consisting of 131,174,413 people shows a poor negative correlation between the proportion of French American Indians and percentage of population with at least doctorate degree education in the United States with a correlation coefficient (R) of -0.140 and weighted average of 1.6%. Similarly, the statistical analysis conducted on geographies consisting of 167,867,619 people shows a weak positive correlation between the proportion of Kenyans and percentage of population with at least doctorate degree education in the United States with a correlation coefficient (R) of 0.236 and weighted average of 1.9%, a difference of 23.5%.
Doctorate Degree Correlation Summary
| Measurement | French American Indian | Kenyan |
| Minimum | 0.24% | 0.37% |
| Maximum | 3.7% | 10.2% |
| Range | 3.4% | 9.9% |
| Mean | 1.2% | 2.2% |
| Median | 1.1% | 1.8% |
| Interquartile 25% (IQ1) | 0.67% | 1.2% |
| Interquartile 75% (IQ3) | 1.7% | 2.0% |
| Interquartile Range (IQR) | 1.0% | 0.83% |
| Standard Deviation (Sample) | 0.77% | 1.8% |
| Standard Deviation (Population) | 0.75% | 1.8% |
Similar Demographics by Doctorate Degree
Demographics Similar to French American Indians by Doctorate Degree
In terms of doctorate degree, the demographic groups most similar to French American Indians are Native Hawaiian (1.6%, a difference of 0.19%), Ottawa (1.6%, a difference of 0.32%), Delaware (1.6%, a difference of 0.38%), Hmong (1.6%, a difference of 0.47%), and Comanche (1.6%, a difference of 0.49%).
| Demographics | Rating | Rank | Doctorate Degree |
| Iroquois | 2.7 /100 | #237 | Tragic 1.6% |
| Immigrants | Congo | 2.6 /100 | #238 | Tragic 1.6% |
| West Indians | 2.5 /100 | #239 | Tragic 1.6% |
| Immigrants | Panama | 2.4 /100 | #240 | Tragic 1.6% |
| Cheyenne | 2.3 /100 | #241 | Tragic 1.6% |
| Ottawa | 2.2 /100 | #242 | Tragic 1.6% |
| Native Hawaiians | 2.1 /100 | #243 | Tragic 1.6% |
| French American Indians | 2.0 /100 | #244 | Tragic 1.6% |
| Delaware | 1.9 /100 | #245 | Tragic 1.6% |
| Hmong | 1.8 /100 | #246 | Tragic 1.6% |
| Comanche | 1.8 /100 | #247 | Tragic 1.6% |
| Africans | 1.8 /100 | #248 | Tragic 1.6% |
| Potawatomi | 1.6 /100 | #249 | Tragic 1.6% |
| Immigrants | Fiji | 1.6 /100 | #250 | Tragic 1.6% |
| Apache | 1.3 /100 | #251 | Tragic 1.5% |
Demographics Similar to Kenyans by Doctorate Degree
In terms of doctorate degree, the demographic groups most similar to Kenyans are Immigrants from Syria (1.9%, a difference of 0.020%), Immigrants from Moldova (2.0%, a difference of 0.18%), Immigrants from Senegal (1.9%, a difference of 0.27%), Sierra Leonean (2.0%, a difference of 0.39%), and Luxembourger (1.9%, a difference of 0.60%).
| Demographics | Rating | Rank | Doctorate Degree |
| Swiss | 88.0 /100 | #138 | Excellent 2.0% |
| Afghans | 87.2 /100 | #139 | Excellent 2.0% |
| Immigrants | Africa | 87.0 /100 | #140 | Excellent 2.0% |
| Senegalese | 86.7 /100 | #141 | Excellent 2.0% |
| Italians | 86.0 /100 | #142 | Excellent 2.0% |
| Sierra Leoneans | 85.1 /100 | #143 | Excellent 2.0% |
| Immigrants | Moldova | 84.3 /100 | #144 | Excellent 2.0% |
| Kenyans | 83.6 /100 | #145 | Excellent 1.9% |
| Immigrants | Syria | 83.6 /100 | #146 | Excellent 1.9% |
| Immigrants | Senegal | 82.5 /100 | #147 | Excellent 1.9% |
| Luxembourgers | 81.1 /100 | #148 | Excellent 1.9% |
| Basques | 76.9 /100 | #149 | Good 1.9% |
| English | 75.9 /100 | #150 | Good 1.9% |
| Albanians | 74.8 /100 | #151 | Good 1.9% |
| Immigrants | Kenya | 74.3 /100 | #152 | Good 1.9% |