Immigrants from Bolivia vs French Canadian 2nd Grade
COMPARE
Immigrants from Bolivia
French Canadian
2nd Grade
2nd Grade Comparison
Immigrants from Bolivia
French Canadians
97.4%
2ND GRADE
0.1/ 100
METRIC RATING
273rd/ 347
METRIC RANK
98.5%
2ND GRADE
100.0/ 100
METRIC RATING
32nd/ 347
METRIC RANK
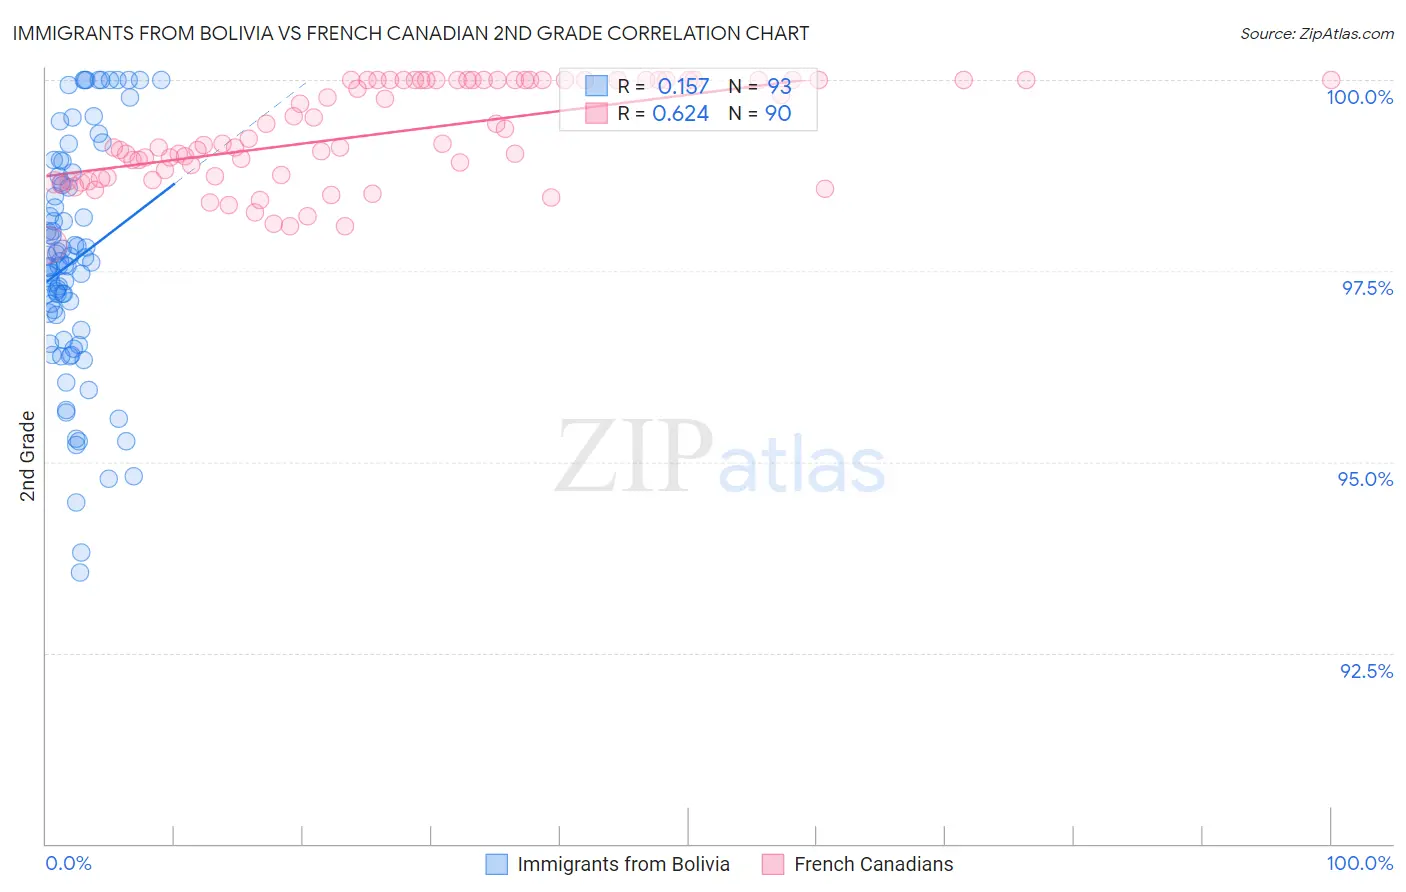
Immigrants from Bolivia vs French Canadian 2nd Grade Correlation Chart
The statistical analysis conducted on geographies consisting of 158,719,692 people shows a poor positive correlation between the proportion of Immigrants from Bolivia and percentage of population with at least 2nd grade education in the United States with a correlation coefficient (R) of 0.157 and weighted average of 97.4%. Similarly, the statistical analysis conducted on geographies consisting of 502,680,064 people shows a significant positive correlation between the proportion of French Canadians and percentage of population with at least 2nd grade education in the United States with a correlation coefficient (R) of 0.624 and weighted average of 98.5%, a difference of 1.2%.
2nd Grade Correlation Summary
| Measurement | Immigrants from Bolivia | French Canadian |
| Minimum | 93.6% | 97.8% |
| Maximum | 100.0% | 100.0% |
| Range | 6.4% | 2.2% |
| Mean | 97.6% | 99.3% |
| Median | 97.6% | 99.2% |
| Interquartile 25% (IQ1) | 96.7% | 98.7% |
| Interquartile 75% (IQ3) | 98.7% | 100.0% |
| Interquartile Range (IQR) | 2.0% | 1.3% |
| Standard Deviation (Sample) | 1.5% | 0.65% |
| Standard Deviation (Population) | 1.5% | 0.64% |
Similar Demographics by 2nd Grade
Demographics Similar to Immigrants from Bolivia by 2nd Grade
In terms of 2nd grade, the demographic groups most similar to Immigrants from Bolivia are Immigrants from Peru (97.4%, a difference of 0.010%), Ghanaian (97.4%, a difference of 0.010%), Immigrants from China (97.3%, a difference of 0.010%), Immigrants from Cameroon (97.4%, a difference of 0.020%), and Immigrants from Jamaica (97.4%, a difference of 0.040%).
| Demographics | Rating | Rank | 2nd Grade |
| Immigrants | Sierra Leone | 0.4 /100 | #266 | Tragic 97.4% |
| Cubans | 0.3 /100 | #267 | Tragic 97.4% |
| Immigrants | Nigeria | 0.3 /100 | #268 | Tragic 97.4% |
| West Indians | 0.3 /100 | #269 | Tragic 97.4% |
| Immigrants | Jamaica | 0.2 /100 | #270 | Tragic 97.4% |
| Immigrants | Cameroon | 0.2 /100 | #271 | Tragic 97.4% |
| Immigrants | Peru | 0.1 /100 | #272 | Tragic 97.4% |
| Immigrants | Bolivia | 0.1 /100 | #273 | Tragic 97.4% |
| Ghanaians | 0.1 /100 | #274 | Tragic 97.4% |
| Immigrants | China | 0.1 /100 | #275 | Tragic 97.3% |
| Immigrants | Philippines | 0.1 /100 | #276 | Tragic 97.3% |
| Immigrants | Western Africa | 0.1 /100 | #277 | Tragic 97.3% |
| Immigrants | Uzbekistan | 0.1 /100 | #278 | Tragic 97.3% |
| Immigrants | Ghana | 0.1 /100 | #279 | Tragic 97.3% |
| Afghans | 0.1 /100 | #280 | Tragic 97.3% |
Demographics Similar to French Canadians by 2nd Grade
In terms of 2nd grade, the demographic groups most similar to French Canadians are European (98.5%, a difference of 0.0%), Czech (98.5%, a difference of 0.0%), Scandinavian (98.5%, a difference of 0.0%), Arapaho (98.5%, a difference of 0.010%), and French (98.5%, a difference of 0.010%).
| Demographics | Rating | Rank | 2nd Grade |
| Scotch-Irish | 100.0 /100 | #25 | Exceptional 98.5% |
| Welsh | 100.0 /100 | #26 | Exceptional 98.5% |
| Croatians | 100.0 /100 | #27 | Exceptional 98.5% |
| Arapaho | 100.0 /100 | #28 | Exceptional 98.5% |
| French | 100.0 /100 | #29 | Exceptional 98.5% |
| Europeans | 100.0 /100 | #30 | Exceptional 98.5% |
| Czechs | 100.0 /100 | #31 | Exceptional 98.5% |
| French Canadians | 100.0 /100 | #32 | Exceptional 98.5% |
| Scandinavians | 100.0 /100 | #33 | Exceptional 98.5% |
| Chinese | 100.0 /100 | #34 | Exceptional 98.5% |
| Swiss | 100.0 /100 | #35 | Exceptional 98.5% |
| British | 100.0 /100 | #36 | Exceptional 98.5% |
| Italians | 99.9 /100 | #37 | Exceptional 98.4% |
| Latvians | 99.9 /100 | #38 | Exceptional 98.4% |
| Chippewa | 99.9 /100 | #39 | Exceptional 98.4% |