Immigrants from Australia vs French Canadian 2nd Grade
COMPARE
Immigrants from Australia
French Canadian
2nd Grade
2nd Grade Comparison
Immigrants from Australia
French Canadians
98.2%
2ND GRADE
99.0/ 100
METRIC RATING
86th/ 347
METRIC RANK
98.5%
2ND GRADE
100.0/ 100
METRIC RATING
32nd/ 347
METRIC RANK
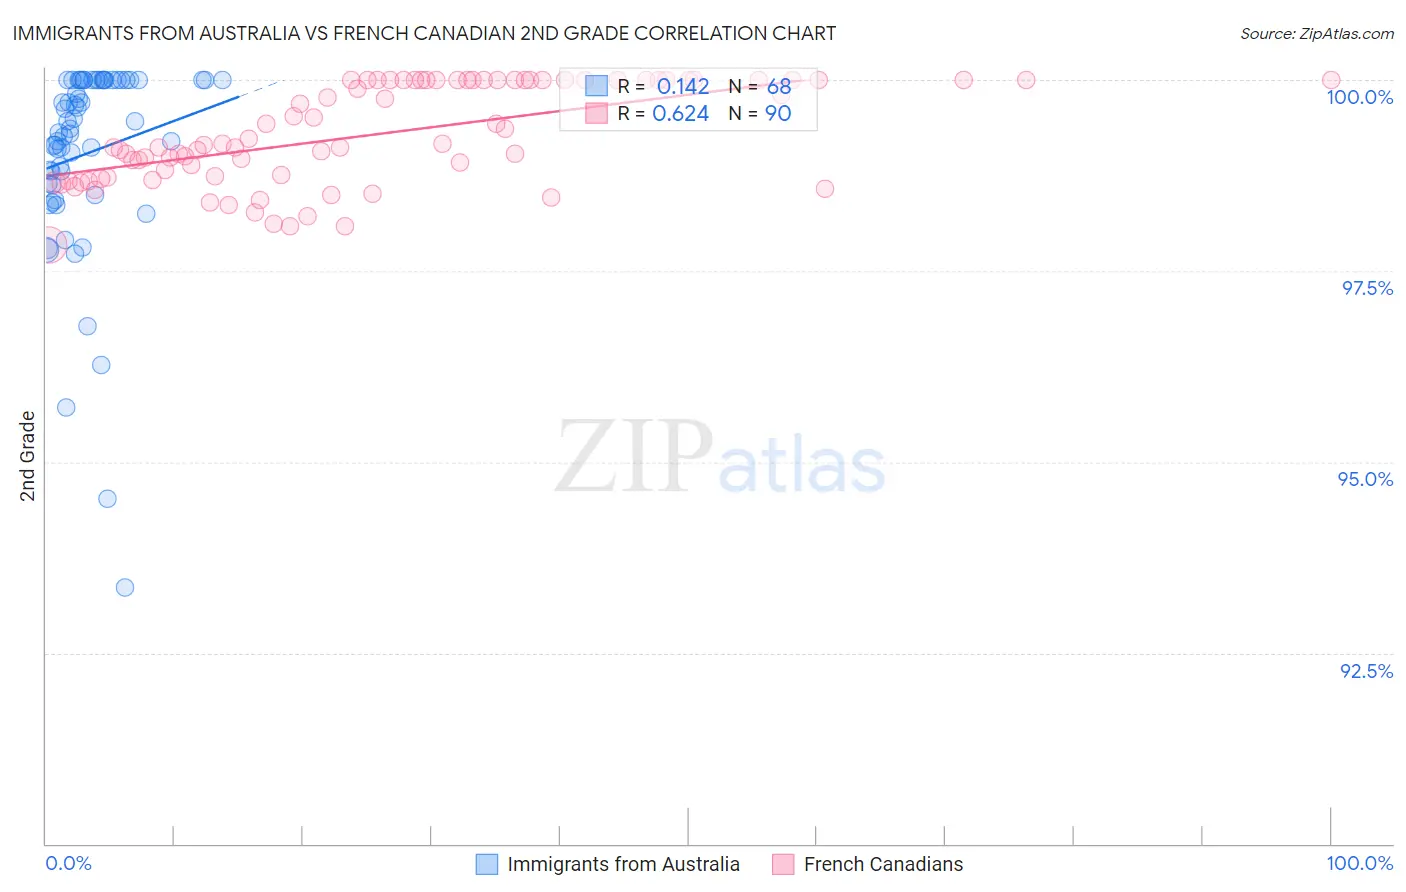
Immigrants from Australia vs French Canadian 2nd Grade Correlation Chart
The statistical analysis conducted on geographies consisting of 227,203,469 people shows a poor positive correlation between the proportion of Immigrants from Australia and percentage of population with at least 2nd grade education in the United States with a correlation coefficient (R) of 0.142 and weighted average of 98.2%. Similarly, the statistical analysis conducted on geographies consisting of 502,680,064 people shows a significant positive correlation between the proportion of French Canadians and percentage of population with at least 2nd grade education in the United States with a correlation coefficient (R) of 0.624 and weighted average of 98.5%, a difference of 0.29%.
2nd Grade Correlation Summary
| Measurement | Immigrants from Australia | French Canadian |
| Minimum | 93.4% | 97.8% |
| Maximum | 100.0% | 100.0% |
| Range | 6.6% | 2.2% |
| Mean | 99.0% | 99.3% |
| Median | 99.4% | 99.2% |
| Interquartile 25% (IQ1) | 98.6% | 98.7% |
| Interquartile 75% (IQ3) | 100.0% | 100.0% |
| Interquartile Range (IQR) | 1.4% | 1.3% |
| Standard Deviation (Sample) | 1.3% | 0.65% |
| Standard Deviation (Population) | 1.3% | 0.64% |
Similar Demographics by 2nd Grade
Demographics Similar to Immigrants from Australia by 2nd Grade
In terms of 2nd grade, the demographic groups most similar to Immigrants from Australia are Potawatomi (98.2%, a difference of 0.0%), Immigrants from Denmark (98.2%, a difference of 0.0%), Macedonian (98.2%, a difference of 0.0%), Icelander (98.2%, a difference of 0.010%), and Delaware (98.2%, a difference of 0.010%).
| Demographics | Rating | Rank | 2nd Grade |
| Immigrants | Belgium | 99.3 /100 | #79 | Exceptional 98.2% |
| Osage | 99.2 /100 | #80 | Exceptional 98.2% |
| Icelanders | 99.2 /100 | #81 | Exceptional 98.2% |
| Delaware | 99.1 /100 | #82 | Exceptional 98.2% |
| Immigrants | Sweden | 99.1 /100 | #83 | Exceptional 98.2% |
| Hopi | 99.1 /100 | #84 | Exceptional 98.2% |
| Potawatomi | 99.1 /100 | #85 | Exceptional 98.2% |
| Immigrants | Australia | 99.0 /100 | #86 | Exceptional 98.2% |
| Immigrants | Denmark | 99.0 /100 | #87 | Exceptional 98.2% |
| Macedonians | 99.0 /100 | #88 | Exceptional 98.2% |
| Ukrainians | 98.9 /100 | #89 | Exceptional 98.2% |
| Zimbabweans | 98.8 /100 | #90 | Exceptional 98.2% |
| Immigrants | Western Europe | 98.8 /100 | #91 | Exceptional 98.2% |
| Immigrants | South Africa | 98.8 /100 | #92 | Exceptional 98.2% |
| Immigrants | India | 98.8 /100 | #93 | Exceptional 98.2% |
Demographics Similar to French Canadians by 2nd Grade
In terms of 2nd grade, the demographic groups most similar to French Canadians are European (98.5%, a difference of 0.0%), Czech (98.5%, a difference of 0.0%), Scandinavian (98.5%, a difference of 0.0%), Arapaho (98.5%, a difference of 0.010%), and French (98.5%, a difference of 0.010%).
| Demographics | Rating | Rank | 2nd Grade |
| Scotch-Irish | 100.0 /100 | #25 | Exceptional 98.5% |
| Welsh | 100.0 /100 | #26 | Exceptional 98.5% |
| Croatians | 100.0 /100 | #27 | Exceptional 98.5% |
| Arapaho | 100.0 /100 | #28 | Exceptional 98.5% |
| French | 100.0 /100 | #29 | Exceptional 98.5% |
| Europeans | 100.0 /100 | #30 | Exceptional 98.5% |
| Czechs | 100.0 /100 | #31 | Exceptional 98.5% |
| French Canadians | 100.0 /100 | #32 | Exceptional 98.5% |
| Scandinavians | 100.0 /100 | #33 | Exceptional 98.5% |
| Chinese | 100.0 /100 | #34 | Exceptional 98.5% |
| Swiss | 100.0 /100 | #35 | Exceptional 98.5% |
| British | 100.0 /100 | #36 | Exceptional 98.5% |
| Italians | 99.9 /100 | #37 | Exceptional 98.4% |
| Latvians | 99.9 /100 | #38 | Exceptional 98.4% |
| Chippewa | 99.9 /100 | #39 | Exceptional 98.4% |