Immigrants from Indonesia vs Peruvian High School Diploma
COMPARE
Immigrants from Indonesia
Peruvian
High School Diploma
High School Diploma Comparison
Immigrants from Indonesia
Peruvians
89.1%
HIGH SCHOOL DIPLOMA
50.3/ 100
METRIC RATING
173rd/ 347
METRIC RANK
87.8%
HIGH SCHOOL DIPLOMA
1.9/ 100
METRIC RATING
245th/ 347
METRIC RANK
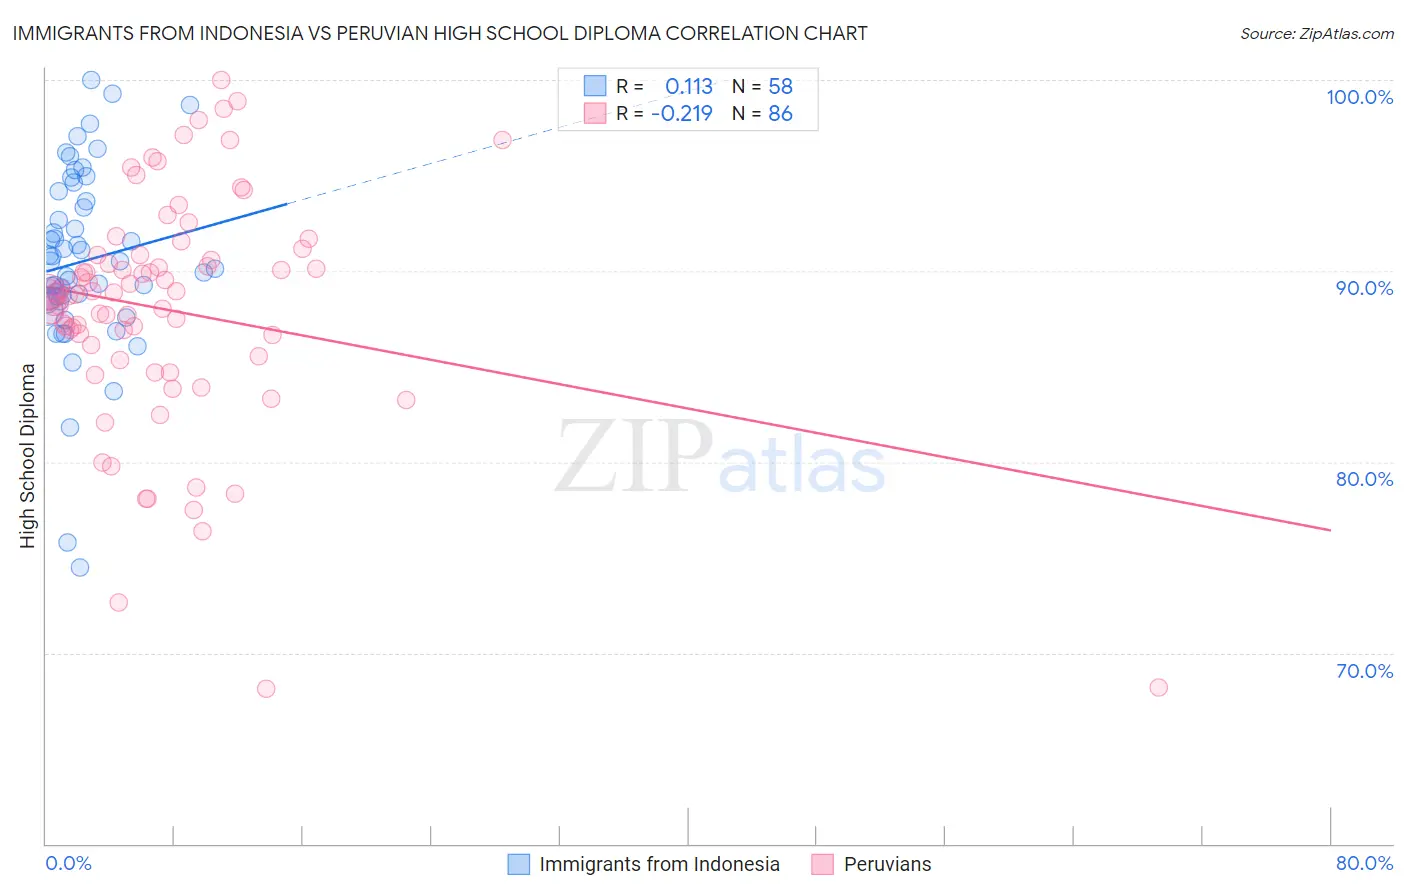
Immigrants from Indonesia vs Peruvian High School Diploma Correlation Chart
The statistical analysis conducted on geographies consisting of 215,765,946 people shows a poor positive correlation between the proportion of Immigrants from Indonesia and percentage of population with at least high school diploma education in the United States with a correlation coefficient (R) of 0.113 and weighted average of 89.1%. Similarly, the statistical analysis conducted on geographies consisting of 363,251,075 people shows a weak negative correlation between the proportion of Peruvians and percentage of population with at least high school diploma education in the United States with a correlation coefficient (R) of -0.219 and weighted average of 87.8%, a difference of 1.5%.
High School Diploma Correlation Summary
| Measurement | Immigrants from Indonesia | Peruvian |
| Minimum | 74.5% | 68.1% |
| Maximum | 100.0% | 100.0% |
| Range | 25.5% | 31.9% |
| Mean | 90.5% | 87.9% |
| Median | 90.3% | 88.8% |
| Interquartile 25% (IQ1) | 88.4% | 85.5% |
| Interquartile 75% (IQ3) | 93.6% | 90.8% |
| Interquartile Range (IQR) | 5.2% | 5.3% |
| Standard Deviation (Sample) | 4.8% | 6.1% |
| Standard Deviation (Population) | 4.8% | 6.1% |
Similar Demographics by High School Diploma
Demographics Similar to Immigrants from Indonesia by High School Diploma
In terms of high school diploma, the demographic groups most similar to Immigrants from Indonesia are Hmong (89.1%, a difference of 0.0%), Nonimmigrants (89.2%, a difference of 0.020%), Immigrants from Western Asia (89.1%, a difference of 0.020%), Osage (89.1%, a difference of 0.020%), and Sudanese (89.1%, a difference of 0.030%).
| Demographics | Rating | Rank | High School Diploma |
| Immigrants | Albania | 59.4 /100 | #166 | Average 89.3% |
| Immigrants | Hong Kong | 58.6 /100 | #167 | Average 89.3% |
| Delaware | 55.8 /100 | #168 | Average 89.2% |
| Iroquois | 55.1 /100 | #169 | Average 89.2% |
| Immigrants | Morocco | 53.3 /100 | #170 | Average 89.2% |
| Spanish | 52.9 /100 | #171 | Average 89.2% |
| Immigrants | Nonimmigrants | 51.8 /100 | #172 | Average 89.2% |
| Immigrants | Indonesia | 50.3 /100 | #173 | Average 89.1% |
| Hmong | 50.0 /100 | #174 | Average 89.1% |
| Immigrants | Western Asia | 49.0 /100 | #175 | Average 89.1% |
| Osage | 48.9 /100 | #176 | Average 89.1% |
| Sudanese | 48.5 /100 | #177 | Average 89.1% |
| Sierra Leoneans | 48.4 /100 | #178 | Average 89.1% |
| Americans | 47.2 /100 | #179 | Average 89.1% |
| Bolivians | 45.2 /100 | #180 | Average 89.1% |
Demographics Similar to Peruvians by High School Diploma
In terms of high school diploma, the demographic groups most similar to Peruvians are Immigrants from Philippines (87.8%, a difference of 0.010%), Choctaw (87.8%, a difference of 0.010%), Immigrants from Eritrea (87.8%, a difference of 0.030%), Immigrants from Uzbekistan (87.8%, a difference of 0.040%), and Cheyenne (87.8%, a difference of 0.040%).
| Demographics | Rating | Rank | High School Diploma |
| Sioux | 2.7 /100 | #238 | Tragic 87.9% |
| South Americans | 2.7 /100 | #239 | Tragic 87.9% |
| Comanche | 2.2 /100 | #240 | Tragic 87.9% |
| Immigrants | Uzbekistan | 2.1 /100 | #241 | Tragic 87.8% |
| Cheyenne | 2.1 /100 | #242 | Tragic 87.8% |
| Immigrants | Philippines | 1.9 /100 | #243 | Tragic 87.8% |
| Choctaw | 1.9 /100 | #244 | Tragic 87.8% |
| Peruvians | 1.9 /100 | #245 | Tragic 87.8% |
| Immigrants | Eritrea | 1.7 /100 | #246 | Tragic 87.8% |
| Immigrants | Costa Rica | 1.7 /100 | #247 | Tragic 87.8% |
| Spanish Americans | 1.5 /100 | #248 | Tragic 87.7% |
| Senegalese | 1.5 /100 | #249 | Tragic 87.7% |
| Immigrants | Nigeria | 1.5 /100 | #250 | Tragic 87.7% |
| Ghanaians | 1.4 /100 | #251 | Tragic 87.7% |
| Immigrants | South America | 1.2 /100 | #252 | Tragic 87.6% |