Filipino vs Celtic Bachelor's Degree
COMPARE
Filipino
Celtic
Bachelor's Degree
Bachelor's Degree Comparison
Filipinos
Celtics
52.7%
BACHELOR'S DEGREE
100.0/ 100
METRIC RATING
1st/ 347
METRIC RANK
37.0%
BACHELOR'S DEGREE
29.5/ 100
METRIC RATING
196th/ 347
METRIC RANK
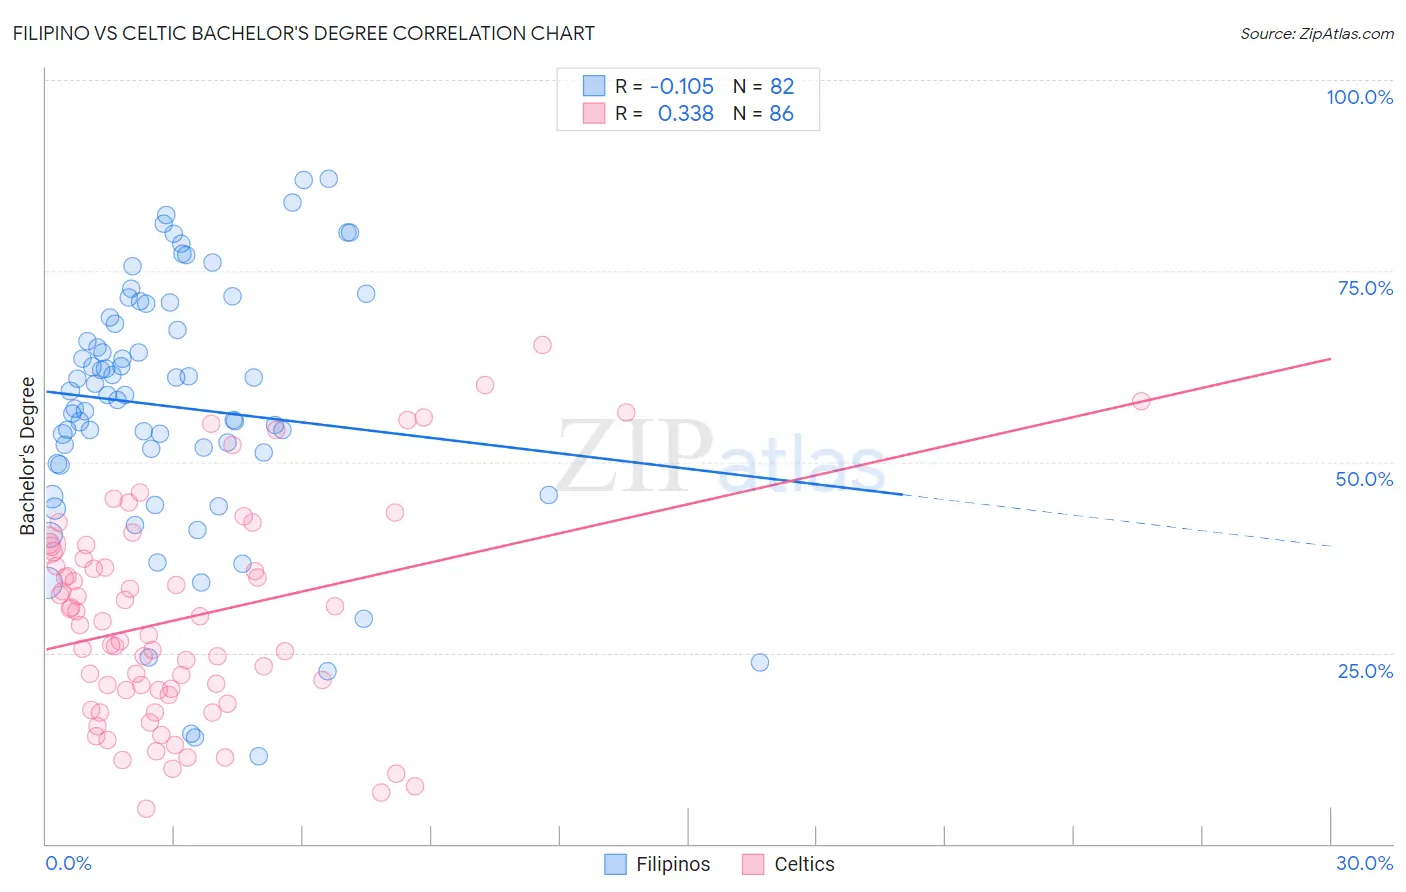
Filipino vs Celtic Bachelor's Degree Correlation Chart
The statistical analysis conducted on geographies consisting of 254,333,448 people shows a poor negative correlation between the proportion of Filipinos and percentage of population with at least bachelor's degree education in the United States with a correlation coefficient (R) of -0.105 and weighted average of 52.7%. Similarly, the statistical analysis conducted on geographies consisting of 168,877,213 people shows a mild positive correlation between the proportion of Celtics and percentage of population with at least bachelor's degree education in the United States with a correlation coefficient (R) of 0.338 and weighted average of 37.0%, a difference of 42.4%.
Bachelor's Degree Correlation Summary
| Measurement | Filipino | Celtic |
| Minimum | 11.5% | 4.5% |
| Maximum | 87.0% | 65.3% |
| Range | 75.5% | 60.7% |
| Mean | 57.2% | 29.6% |
| Median | 58.7% | 28.9% |
| Interquartile 25% (IQ1) | 49.7% | 20.1% |
| Interquartile 75% (IQ3) | 68.9% | 38.2% |
| Interquartile Range (IQR) | 19.1% | 18.1% |
| Standard Deviation (Sample) | 16.9% | 13.8% |
| Standard Deviation (Population) | 16.8% | 13.7% |
Similar Demographics by Bachelor's Degree
Demographics Similar to Filipinos by Bachelor's Degree
In terms of bachelor's degree, the demographic groups most similar to Filipinos are Immigrants from Singapore (51.9%, a difference of 1.5%), Immigrants from India (51.3%, a difference of 2.8%), Immigrants from Taiwan (51.2%, a difference of 3.0%), Iranian (51.0%, a difference of 3.4%), and Okinawan (50.5%, a difference of 4.3%).
| Demographics | Rating | Rank | Bachelor's Degree |
| Filipinos | 100.0 /100 | #1 | Exceptional 52.7% |
| Immigrants | Singapore | 100.0 /100 | #2 | Exceptional 51.9% |
| Immigrants | India | 100.0 /100 | #3 | Exceptional 51.3% |
| Immigrants | Taiwan | 100.0 /100 | #4 | Exceptional 51.2% |
| Iranians | 100.0 /100 | #5 | Exceptional 51.0% |
| Okinawans | 100.0 /100 | #6 | Exceptional 50.5% |
| Immigrants | Iran | 100.0 /100 | #7 | Exceptional 50.3% |
| Thais | 100.0 /100 | #8 | Exceptional 50.1% |
| Immigrants | Israel | 100.0 /100 | #9 | Exceptional 50.0% |
| Cypriots | 100.0 /100 | #10 | Exceptional 49.0% |
| Immigrants | Australia | 100.0 /100 | #11 | Exceptional 48.5% |
| Immigrants | China | 100.0 /100 | #12 | Exceptional 48.4% |
| Immigrants | South Central Asia | 100.0 /100 | #13 | Exceptional 48.3% |
| Immigrants | Hong Kong | 100.0 /100 | #14 | Exceptional 48.2% |
| Immigrants | Eastern Asia | 100.0 /100 | #15 | Exceptional 48.1% |
Demographics Similar to Celtics by Bachelor's Degree
In terms of bachelor's degree, the demographic groups most similar to Celtics are Korean (37.0%, a difference of 0.030%), Belgian (37.0%, a difference of 0.040%), Czechoslovakian (37.0%, a difference of 0.040%), Welsh (37.0%, a difference of 0.050%), and Yugoslavian (37.1%, a difference of 0.23%).
| Demographics | Rating | Rank | Bachelor's Degree |
| Slovaks | 36.9 /100 | #189 | Fair 37.3% |
| Swiss | 34.1 /100 | #190 | Fair 37.2% |
| Nigerians | 33.9 /100 | #191 | Fair 37.2% |
| Immigrants | Vietnam | 32.1 /100 | #192 | Fair 37.1% |
| Yugoslavians | 31.5 /100 | #193 | Fair 37.1% |
| Belgians | 29.9 /100 | #194 | Fair 37.0% |
| Koreans | 29.8 /100 | #195 | Fair 37.0% |
| Celtics | 29.5 /100 | #196 | Fair 37.0% |
| Czechoslovakians | 29.2 /100 | #197 | Fair 37.0% |
| Welsh | 29.1 /100 | #198 | Fair 37.0% |
| Immigrants | Costa Rica | 27.4 /100 | #199 | Fair 36.9% |
| Immigrants | Ghana | 27.4 /100 | #200 | Fair 36.9% |
| Immigrants | South Eastern Asia | 25.4 /100 | #201 | Fair 36.8% |
| Immigrants | Zaire | 25.3 /100 | #202 | Fair 36.8% |
| Immigrants | Nigeria | 23.1 /100 | #203 | Fair 36.7% |