Filipino vs Immigrants from El Salvador 4th Grade
COMPARE
Filipino
Immigrants from El Salvador
4th Grade
4th Grade Comparison
Filipinos
Immigrants from El Salvador
97.7%
4TH GRADE
84.0/ 100
METRIC RATING
140th/ 347
METRIC RANK
94.8%
4TH GRADE
0.0/ 100
METRIC RATING
346th/ 347
METRIC RANK
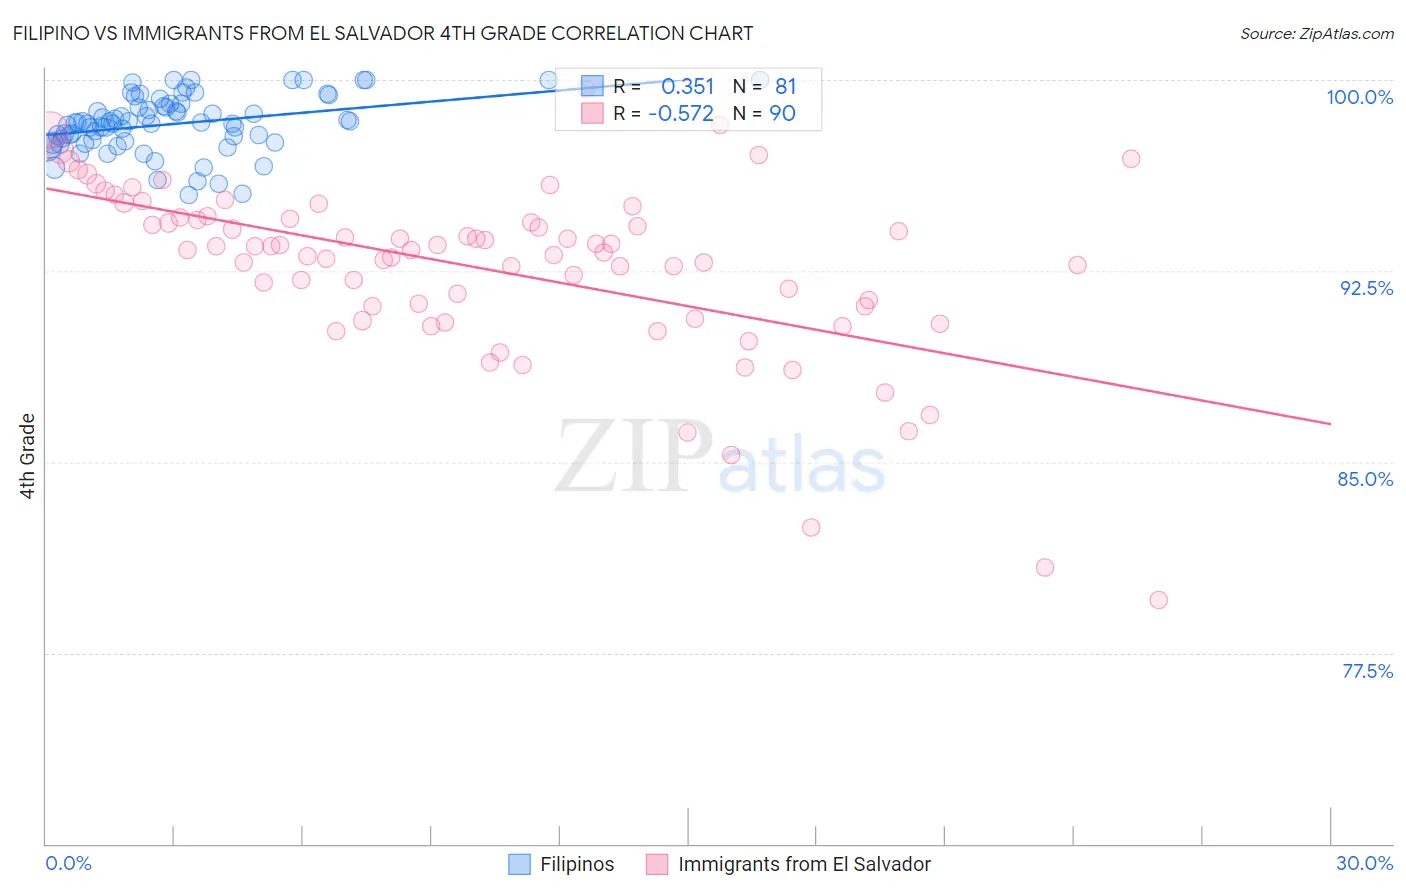
Filipino vs Immigrants from El Salvador 4th Grade Correlation Chart
The statistical analysis conducted on geographies consisting of 254,351,427 people shows a mild positive correlation between the proportion of Filipinos and percentage of population with at least 4th grade education in the United States with a correlation coefficient (R) of 0.351 and weighted average of 97.7%. Similarly, the statistical analysis conducted on geographies consisting of 357,852,938 people shows a substantial negative correlation between the proportion of Immigrants from El Salvador and percentage of population with at least 4th grade education in the United States with a correlation coefficient (R) of -0.572 and weighted average of 94.8%, a difference of 3.0%.
4th Grade Correlation Summary
| Measurement | Filipino | Immigrants from El Salvador |
| Minimum | 95.5% | 79.5% |
| Maximum | 100.0% | 99.7% |
| Range | 4.5% | 20.1% |
| Mean | 98.3% | 92.6% |
| Median | 98.3% | 93.3% |
| Interquartile 25% (IQ1) | 97.6% | 91.1% |
| Interquartile 75% (IQ3) | 99.0% | 94.6% |
| Interquartile Range (IQR) | 1.4% | 3.4% |
| Standard Deviation (Sample) | 1.1% | 3.5% |
| Standard Deviation (Population) | 1.1% | 3.5% |
Similar Demographics by 4th Grade
Demographics Similar to Filipinos by 4th Grade
In terms of 4th grade, the demographic groups most similar to Filipinos are Seminole (97.7%, a difference of 0.0%), Immigrants from Greece (97.7%, a difference of 0.0%), Immigrants from Turkey (97.7%, a difference of 0.010%), Blackfeet (97.7%, a difference of 0.010%), and Immigrants from North Macedonia (97.7%, a difference of 0.010%).
| Demographics | Rating | Rank | 4th Grade |
| Hmong | 88.2 /100 | #133 | Excellent 97.7% |
| Palestinians | 88.1 /100 | #134 | Excellent 97.7% |
| Cambodians | 87.8 /100 | #135 | Excellent 97.7% |
| Israelis | 86.2 /100 | #136 | Excellent 97.7% |
| Immigrants | Turkey | 86.0 /100 | #137 | Excellent 97.7% |
| Blackfeet | 86.0 /100 | #138 | Excellent 97.7% |
| Seminole | 84.7 /100 | #139 | Excellent 97.7% |
| Filipinos | 84.0 /100 | #140 | Excellent 97.7% |
| Immigrants | Greece | 83.8 /100 | #141 | Excellent 97.7% |
| Immigrants | North Macedonia | 83.3 /100 | #142 | Excellent 97.7% |
| Burmese | 82.8 /100 | #143 | Excellent 97.7% |
| Spaniards | 82.7 /100 | #144 | Excellent 97.7% |
| Immigrants | Moldova | 82.4 /100 | #145 | Excellent 97.7% |
| Jordanians | 81.3 /100 | #146 | Excellent 97.7% |
| Ute | 80.6 /100 | #147 | Excellent 97.7% |
Demographics Similar to Immigrants from El Salvador by 4th Grade
In terms of 4th grade, the demographic groups most similar to Immigrants from El Salvador are Spanish American Indian (94.6%, a difference of 0.18%), Salvadoran (95.0%, a difference of 0.28%), Immigrants from Mexico (95.1%, a difference of 0.29%), Immigrants from Guatemala (95.1%, a difference of 0.32%), and Immigrants from Central America (95.1%, a difference of 0.35%).
| Demographics | Rating | Rank | 4th Grade |
| Immigrants | Dominican Republic | 0.0 /100 | #333 | Tragic 95.7% |
| Immigrants | Cabo Verde | 0.0 /100 | #334 | Tragic 95.7% |
| Immigrants | Latin America | 0.0 /100 | #335 | Tragic 95.7% |
| Mexicans | 0.0 /100 | #336 | Tragic 95.6% |
| Central Americans | 0.0 /100 | #337 | Tragic 95.5% |
| Nepalese | 0.0 /100 | #338 | Tragic 95.5% |
| Guatemalans | 0.0 /100 | #339 | Tragic 95.3% |
| Yakama | 0.0 /100 | #340 | Tragic 95.2% |
| Immigrants | Yemen | 0.0 /100 | #341 | Tragic 95.2% |
| Immigrants | Central America | 0.0 /100 | #342 | Tragic 95.1% |
| Immigrants | Guatemala | 0.0 /100 | #343 | Tragic 95.1% |
| Immigrants | Mexico | 0.0 /100 | #344 | Tragic 95.1% |
| Salvadorans | 0.0 /100 | #345 | Tragic 95.0% |
| Immigrants | El Salvador | 0.0 /100 | #346 | Tragic 94.8% |
| Spanish American Indians | 0.0 /100 | #347 | Tragic 94.6% |