Immigrants from South Eastern Asia vs Jamaican 8th Grade
COMPARE
Immigrants from South Eastern Asia
Jamaican
8th Grade
8th Grade Comparison
Immigrants from South Eastern Asia
Jamaicans
94.2%
8TH GRADE
0.0/ 100
METRIC RATING
297th/ 347
METRIC RANK
95.1%
8TH GRADE
1.4/ 100
METRIC RATING
245th/ 347
METRIC RANK
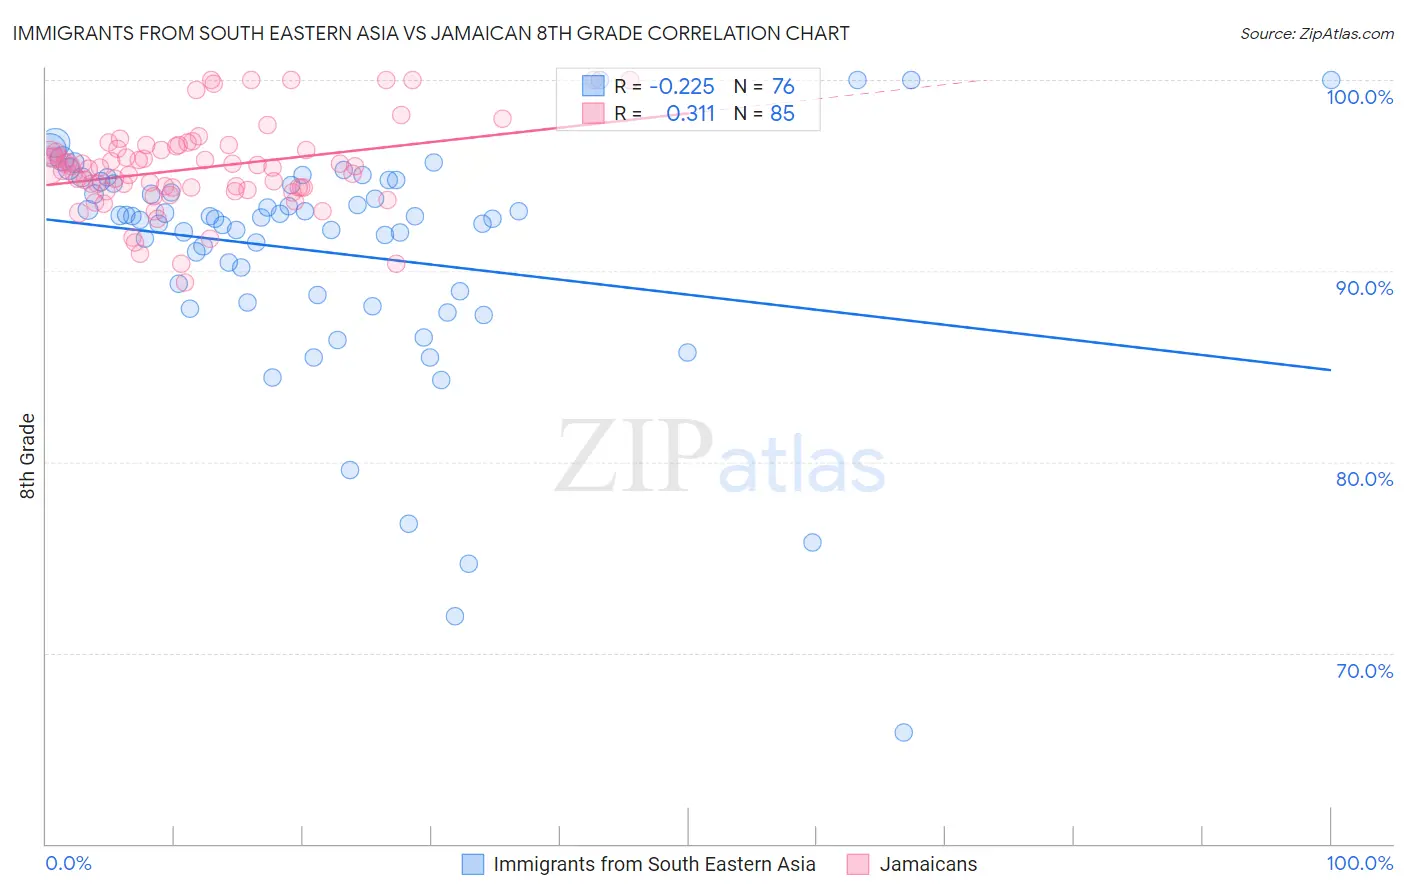
Immigrants from South Eastern Asia vs Jamaican 8th Grade Correlation Chart
The statistical analysis conducted on geographies consisting of 512,710,223 people shows a weak negative correlation between the proportion of Immigrants from South Eastern Asia and percentage of population with at least 8th grade education in the United States with a correlation coefficient (R) of -0.225 and weighted average of 94.2%. Similarly, the statistical analysis conducted on geographies consisting of 368,084,732 people shows a mild positive correlation between the proportion of Jamaicans and percentage of population with at least 8th grade education in the United States with a correlation coefficient (R) of 0.311 and weighted average of 95.1%, a difference of 0.95%.
8th Grade Correlation Summary
| Measurement | Immigrants from South Eastern Asia | Jamaican |
| Minimum | 65.9% | 89.4% |
| Maximum | 100.0% | 100.0% |
| Range | 34.1% | 10.6% |
| Mean | 91.0% | 95.4% |
| Median | 92.8% | 95.4% |
| Interquartile 25% (IQ1) | 88.8% | 94.3% |
| Interquartile 75% (IQ3) | 94.6% | 96.5% |
| Interquartile Range (IQR) | 5.7% | 2.2% |
| Standard Deviation (Sample) | 6.2% | 2.3% |
| Standard Deviation (Population) | 6.1% | 2.3% |
Similar Demographics by 8th Grade
Demographics Similar to Immigrants from South Eastern Asia by 8th Grade
In terms of 8th grade, the demographic groups most similar to Immigrants from South Eastern Asia are Haitian (94.2%, a difference of 0.010%), Fijian (94.2%, a difference of 0.030%), Yaqui (94.2%, a difference of 0.040%), Houma (94.2%, a difference of 0.040%), and Indonesian (94.1%, a difference of 0.040%).
| Demographics | Rating | Rank | 8th Grade |
| Immigrants | West Indies | 0.0 /100 | #290 | Tragic 94.3% |
| Immigrants | Grenada | 0.0 /100 | #291 | Tragic 94.3% |
| Bangladeshis | 0.0 /100 | #292 | Tragic 94.3% |
| Yaqui | 0.0 /100 | #293 | Tragic 94.2% |
| Houma | 0.0 /100 | #294 | Tragic 94.2% |
| Fijians | 0.0 /100 | #295 | Tragic 94.2% |
| Haitians | 0.0 /100 | #296 | Tragic 94.2% |
| Immigrants | South Eastern Asia | 0.0 /100 | #297 | Tragic 94.2% |
| Indonesians | 0.0 /100 | #298 | Tragic 94.1% |
| Cubans | 0.0 /100 | #299 | Tragic 94.1% |
| Immigrants | Burma/Myanmar | 0.0 /100 | #300 | Tragic 94.1% |
| Immigrants | Laos | 0.0 /100 | #301 | Tragic 94.1% |
| Sri Lankans | 0.0 /100 | #302 | Tragic 94.0% |
| Immigrants | Dominica | 0.0 /100 | #303 | Tragic 94.0% |
| Guyanese | 0.0 /100 | #304 | Tragic 93.9% |
Demographics Similar to Jamaicans by 8th Grade
In terms of 8th grade, the demographic groups most similar to Jamaicans are Somali (95.1%, a difference of 0.010%), Immigrants from Senegal (95.1%, a difference of 0.010%), Uruguayan (95.1%, a difference of 0.020%), Tongan (95.1%, a difference of 0.030%), and Paiute (95.1%, a difference of 0.030%).
| Demographics | Rating | Rank | 8th Grade |
| Natives/Alaskans | 2.3 /100 | #238 | Tragic 95.2% |
| Immigrants | Sierra Leone | 2.1 /100 | #239 | Tragic 95.1% |
| Ethiopians | 2.0 /100 | #240 | Tragic 95.1% |
| South American Indians | 1.9 /100 | #241 | Tragic 95.1% |
| Tongans | 1.7 /100 | #242 | Tragic 95.1% |
| Paiute | 1.7 /100 | #243 | Tragic 95.1% |
| Immigrants | Middle Africa | 1.7 /100 | #244 | Tragic 95.1% |
| Jamaicans | 1.4 /100 | #245 | Tragic 95.1% |
| Somalis | 1.4 /100 | #246 | Tragic 95.1% |
| Immigrants | Senegal | 1.4 /100 | #247 | Tragic 95.1% |
| Uruguayans | 1.2 /100 | #248 | Tragic 95.1% |
| Immigrants | China | 1.1 /100 | #249 | Tragic 95.0% |
| Koreans | 1.1 /100 | #250 | Tragic 95.0% |
| Bolivians | 1.0 /100 | #251 | Tragic 95.0% |
| Immigrants | Ethiopia | 1.0 /100 | #252 | Tragic 95.0% |