Chilean vs Jamaican 8th Grade
COMPARE
Chilean
Jamaican
8th Grade
8th Grade Comparison
Chileans
Jamaicans
95.7%
8TH GRADE
50.0/ 100
METRIC RATING
174th/ 347
METRIC RANK
95.1%
8TH GRADE
1.4/ 100
METRIC RATING
245th/ 347
METRIC RANK
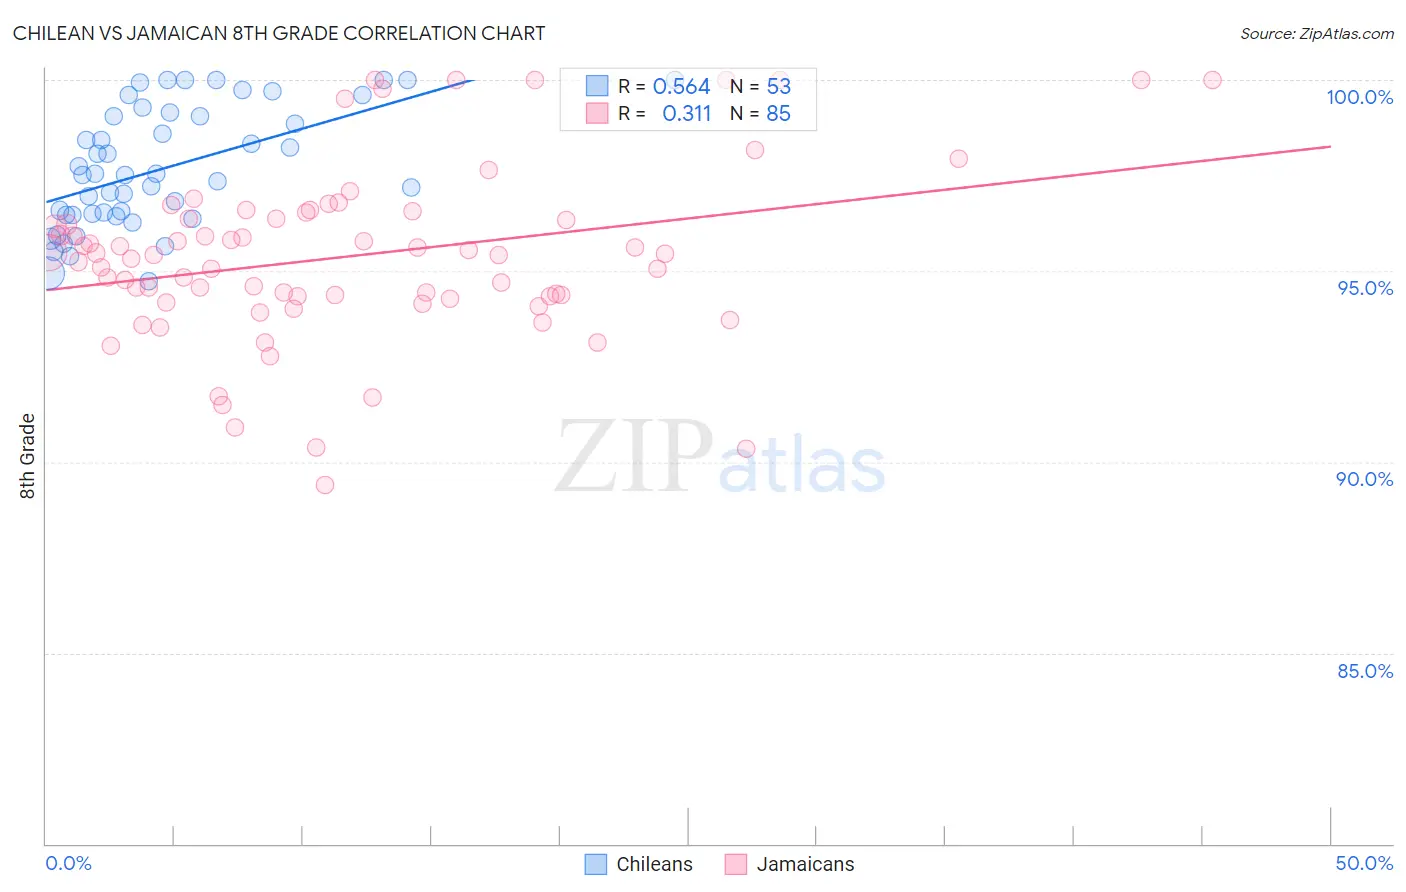
Chilean vs Jamaican 8th Grade Correlation Chart
The statistical analysis conducted on geographies consisting of 256,681,007 people shows a substantial positive correlation between the proportion of Chileans and percentage of population with at least 8th grade education in the United States with a correlation coefficient (R) of 0.564 and weighted average of 95.7%. Similarly, the statistical analysis conducted on geographies consisting of 368,084,732 people shows a mild positive correlation between the proportion of Jamaicans and percentage of population with at least 8th grade education in the United States with a correlation coefficient (R) of 0.311 and weighted average of 95.1%, a difference of 0.69%.
8th Grade Correlation Summary
| Measurement | Chilean | Jamaican |
| Minimum | 94.7% | 89.4% |
| Maximum | 100.0% | 100.0% |
| Range | 5.3% | 10.6% |
| Mean | 97.7% | 95.4% |
| Median | 97.5% | 95.4% |
| Interquartile 25% (IQ1) | 96.5% | 94.3% |
| Interquartile 75% (IQ3) | 99.1% | 96.5% |
| Interquartile Range (IQR) | 2.6% | 2.2% |
| Standard Deviation (Sample) | 1.6% | 2.3% |
| Standard Deviation (Population) | 1.5% | 2.3% |
Similar Demographics by 8th Grade
Demographics Similar to Chileans by 8th Grade
In terms of 8th grade, the demographic groups most similar to Chileans are Immigrants from Albania (95.7%, a difference of 0.0%), Pakistani (95.7%, a difference of 0.010%), Mongolian (95.8%, a difference of 0.020%), Marshallese (95.7%, a difference of 0.020%), and Venezuelan (95.7%, a difference of 0.020%).
| Demographics | Rating | Rank | 8th Grade |
| Spaniards | 60.0 /100 | #167 | Good 95.8% |
| Immigrants | Ukraine | 59.5 /100 | #168 | Average 95.8% |
| Immigrants | Iran | 58.6 /100 | #169 | Average 95.8% |
| Ute | 58.5 /100 | #170 | Average 95.8% |
| Egyptians | 58.2 /100 | #171 | Average 95.8% |
| Immigrants | Korea | 57.9 /100 | #172 | Average 95.8% |
| Mongolians | 53.0 /100 | #173 | Average 95.8% |
| Chileans | 50.0 /100 | #174 | Average 95.7% |
| Immigrants | Albania | 49.6 /100 | #175 | Average 95.7% |
| Pakistanis | 48.8 /100 | #176 | Average 95.7% |
| Marshallese | 47.6 /100 | #177 | Average 95.7% |
| Venezuelans | 47.5 /100 | #178 | Average 95.7% |
| Immigrants | Brazil | 45.4 /100 | #179 | Average 95.7% |
| Iraqis | 40.5 /100 | #180 | Average 95.7% |
| Immigrants | Spain | 38.7 /100 | #181 | Fair 95.7% |
Demographics Similar to Jamaicans by 8th Grade
In terms of 8th grade, the demographic groups most similar to Jamaicans are Somali (95.1%, a difference of 0.010%), Immigrants from Senegal (95.1%, a difference of 0.010%), Uruguayan (95.1%, a difference of 0.020%), Tongan (95.1%, a difference of 0.030%), and Paiute (95.1%, a difference of 0.030%).
| Demographics | Rating | Rank | 8th Grade |
| Natives/Alaskans | 2.3 /100 | #238 | Tragic 95.2% |
| Immigrants | Sierra Leone | 2.1 /100 | #239 | Tragic 95.1% |
| Ethiopians | 2.0 /100 | #240 | Tragic 95.1% |
| South American Indians | 1.9 /100 | #241 | Tragic 95.1% |
| Tongans | 1.7 /100 | #242 | Tragic 95.1% |
| Paiute | 1.7 /100 | #243 | Tragic 95.1% |
| Immigrants | Middle Africa | 1.7 /100 | #244 | Tragic 95.1% |
| Jamaicans | 1.4 /100 | #245 | Tragic 95.1% |
| Somalis | 1.4 /100 | #246 | Tragic 95.1% |
| Immigrants | Senegal | 1.4 /100 | #247 | Tragic 95.1% |
| Uruguayans | 1.2 /100 | #248 | Tragic 95.1% |
| Immigrants | China | 1.1 /100 | #249 | Tragic 95.0% |
| Koreans | 1.1 /100 | #250 | Tragic 95.0% |
| Bolivians | 1.0 /100 | #251 | Tragic 95.0% |
| Immigrants | Ethiopia | 1.0 /100 | #252 | Tragic 95.0% |