Fijian vs Austrian 11th Grade
COMPARE
Fijian
Austrian
11th Grade
11th Grade Comparison
Fijians
Austrians
90.0%
11TH GRADE
0.0/ 100
METRIC RATING
296th/ 347
METRIC RANK
94.0%
11TH GRADE
99.8/ 100
METRIC RATING
62nd/ 347
METRIC RANK
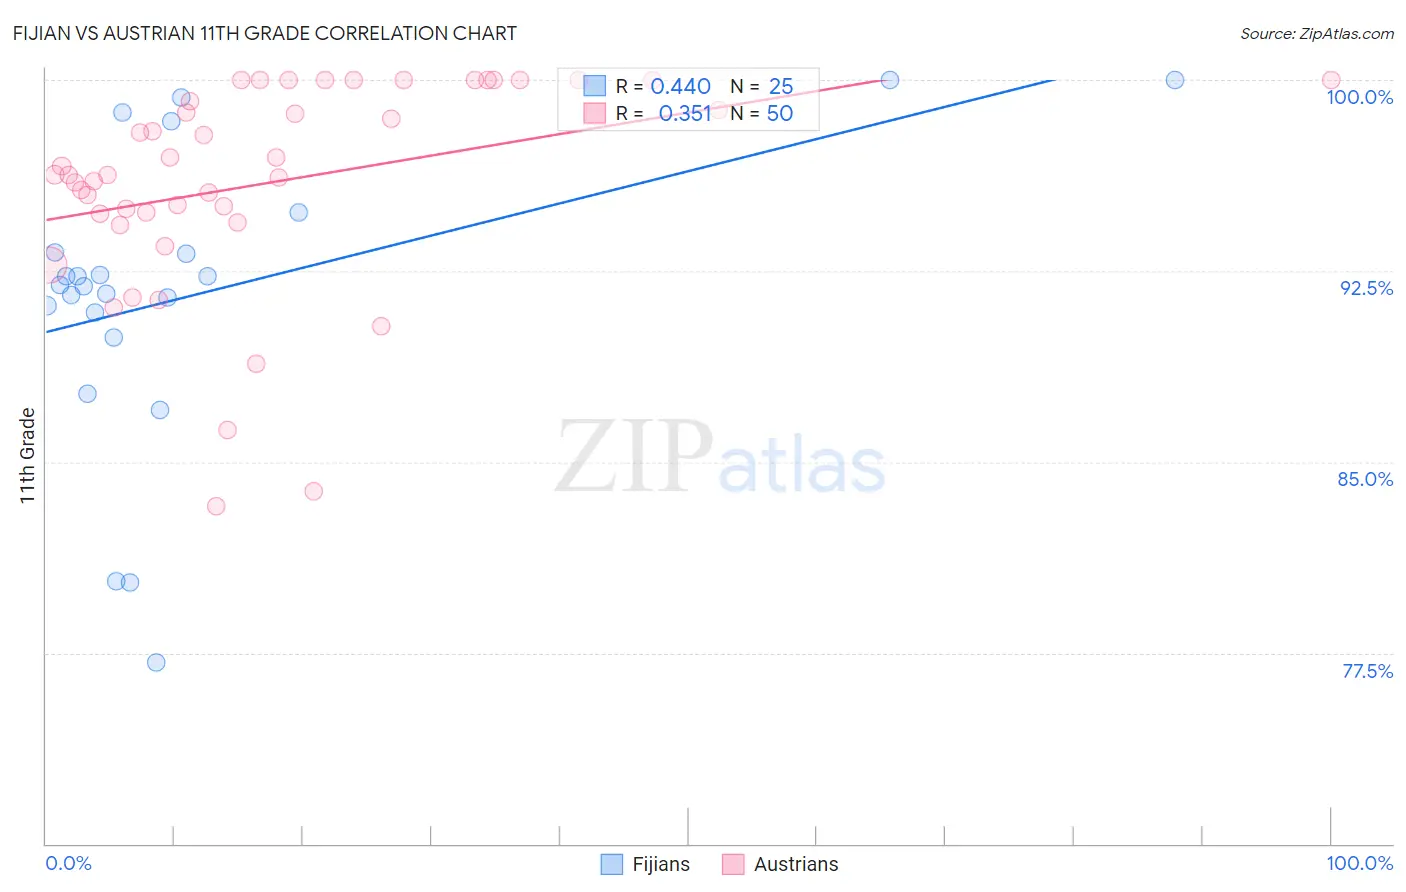
Fijian vs Austrian 11th Grade Correlation Chart
The statistical analysis conducted on geographies consisting of 55,948,842 people shows a moderate positive correlation between the proportion of Fijians and percentage of population with at least 11th grade education in the United States with a correlation coefficient (R) of 0.440 and weighted average of 90.0%. Similarly, the statistical analysis conducted on geographies consisting of 452,082,820 people shows a mild positive correlation between the proportion of Austrians and percentage of population with at least 11th grade education in the United States with a correlation coefficient (R) of 0.351 and weighted average of 94.0%, a difference of 4.4%.
11th Grade Correlation Summary
| Measurement | Fijian | Austrian |
| Minimum | 77.1% | 83.3% |
| Maximum | 100.0% | 100.0% |
| Range | 22.9% | 16.7% |
| Mean | 91.6% | 96.0% |
| Median | 92.0% | 96.3% |
| Interquartile 25% (IQ1) | 90.4% | 94.7% |
| Interquartile 75% (IQ3) | 94.0% | 100.0% |
| Interquartile Range (IQR) | 3.6% | 5.3% |
| Standard Deviation (Sample) | 5.8% | 4.1% |
| Standard Deviation (Population) | 5.7% | 4.1% |
Similar Demographics by 11th Grade
Demographics Similar to Fijians by 11th Grade
In terms of 11th grade, the demographic groups most similar to Fijians are Immigrants from Vietnam (90.0%, a difference of 0.020%), Navajo (90.0%, a difference of 0.040%), Immigrants from Fiji (89.9%, a difference of 0.11%), Immigrants from Grenada (90.1%, a difference of 0.12%), and Japanese (89.9%, a difference of 0.14%).
| Demographics | Rating | Rank | 11th Grade |
| British West Indians | 0.0 /100 | #289 | Tragic 90.3% |
| Indonesians | 0.0 /100 | #290 | Tragic 90.3% |
| Haitians | 0.0 /100 | #291 | Tragic 90.3% |
| Cubans | 0.0 /100 | #292 | Tragic 90.2% |
| Natives/Alaskans | 0.0 /100 | #293 | Tragic 90.2% |
| Immigrants | Grenada | 0.0 /100 | #294 | Tragic 90.1% |
| Immigrants | Vietnam | 0.0 /100 | #295 | Tragic 90.0% |
| Fijians | 0.0 /100 | #296 | Tragic 90.0% |
| Navajo | 0.0 /100 | #297 | Tragic 90.0% |
| Immigrants | Fiji | 0.0 /100 | #298 | Tragic 89.9% |
| Japanese | 0.0 /100 | #299 | Tragic 89.9% |
| Immigrants | Haiti | 0.0 /100 | #300 | Tragic 89.9% |
| Guyanese | 0.0 /100 | #301 | Tragic 89.9% |
| Immigrants | Guyana | 0.0 /100 | #302 | Tragic 89.7% |
| Immigrants | Immigrants | 0.0 /100 | #303 | Tragic 89.7% |
Demographics Similar to Austrians by 11th Grade
In terms of 11th grade, the demographic groups most similar to Austrians are Immigrants from Belgium (94.0%, a difference of 0.0%), French Canadian (94.0%, a difference of 0.010%), New Zealander (94.0%, a difference of 0.010%), Iranian (94.0%, a difference of 0.010%), and Bhutanese (94.0%, a difference of 0.010%).
| Demographics | Rating | Rank | 11th Grade |
| Czechoslovakians | 99.9 /100 | #55 | Exceptional 94.0% |
| French Canadians | 99.9 /100 | #56 | Exceptional 94.0% |
| New Zealanders | 99.9 /100 | #57 | Exceptional 94.0% |
| Iranians | 99.9 /100 | #58 | Exceptional 94.0% |
| Bhutanese | 99.8 /100 | #59 | Exceptional 94.0% |
| Okinawans | 99.8 /100 | #60 | Exceptional 94.0% |
| Immigrants | Belgium | 99.8 /100 | #61 | Exceptional 94.0% |
| Austrians | 99.8 /100 | #62 | Exceptional 94.0% |
| Ukrainians | 99.8 /100 | #63 | Exceptional 94.0% |
| Immigrants | Sweden | 99.8 /100 | #64 | Exceptional 93.9% |
| Native Hawaiians | 99.8 /100 | #65 | Exceptional 93.9% |
| Alaskan Athabascans | 99.8 /100 | #66 | Exceptional 93.9% |
| Immigrants | Netherlands | 99.8 /100 | #67 | Exceptional 93.9% |
| Zimbabweans | 99.8 /100 | #68 | Exceptional 93.9% |
| Scotch-Irish | 99.8 /100 | #69 | Exceptional 93.9% |