Fijian vs Immigrants from Peru 11th Grade
COMPARE
Fijian
Immigrants from Peru
11th Grade
11th Grade Comparison
Fijians
Immigrants from Peru
90.0%
11TH GRADE
0.0/ 100
METRIC RATING
296th/ 347
METRIC RANK
91.0%
11TH GRADE
0.1/ 100
METRIC RATING
271st/ 347
METRIC RANK
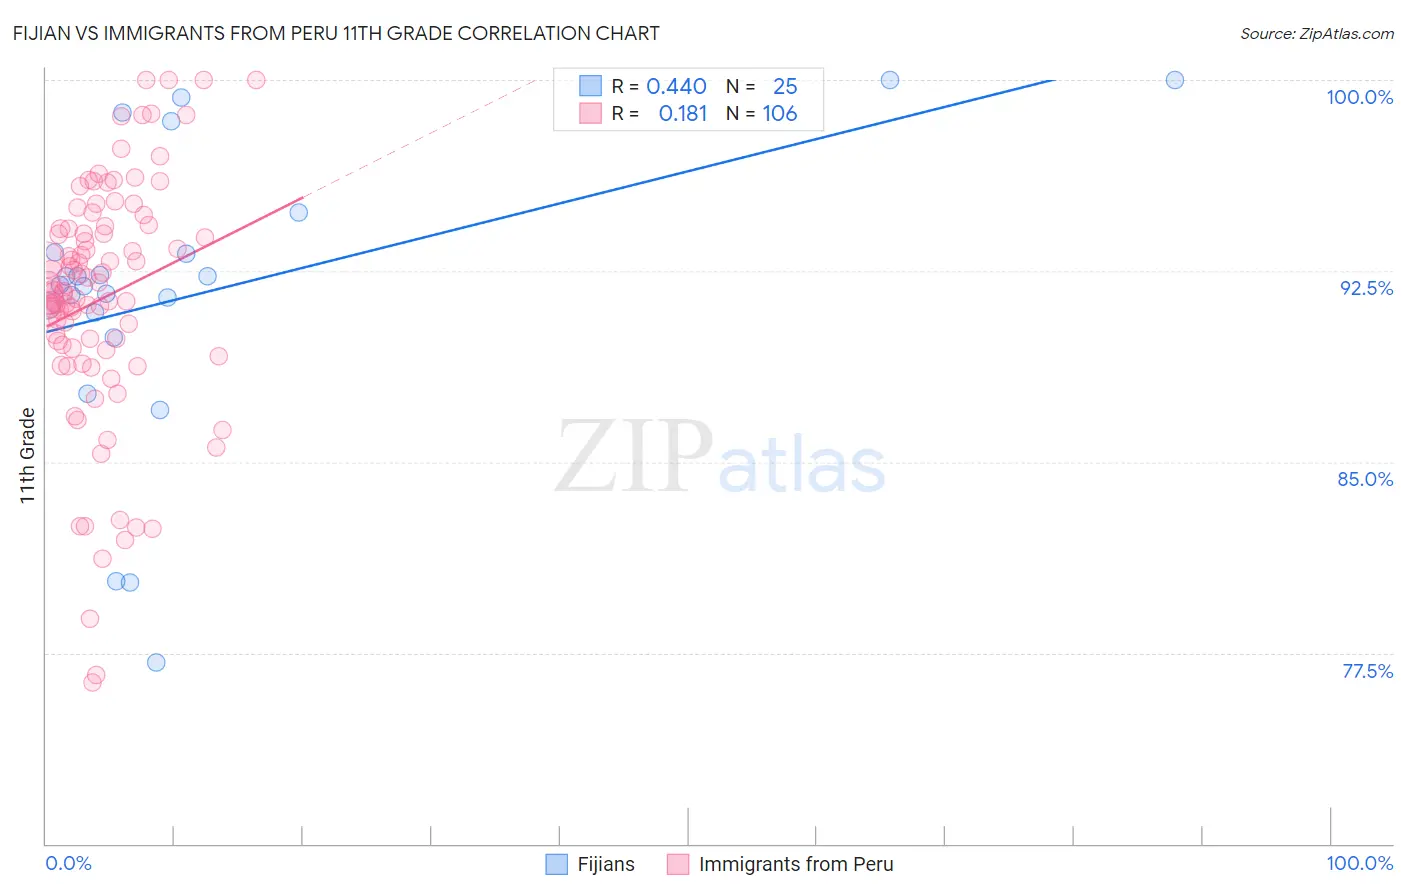
Fijian vs Immigrants from Peru 11th Grade Correlation Chart
The statistical analysis conducted on geographies consisting of 55,948,842 people shows a moderate positive correlation between the proportion of Fijians and percentage of population with at least 11th grade education in the United States with a correlation coefficient (R) of 0.440 and weighted average of 90.0%. Similarly, the statistical analysis conducted on geographies consisting of 328,860,880 people shows a poor positive correlation between the proportion of Immigrants from Peru and percentage of population with at least 11th grade education in the United States with a correlation coefficient (R) of 0.181 and weighted average of 91.0%, a difference of 1.1%.
11th Grade Correlation Summary
| Measurement | Fijian | Immigrants from Peru |
| Minimum | 77.1% | 76.3% |
| Maximum | 100.0% | 100.0% |
| Range | 22.9% | 23.7% |
| Mean | 91.6% | 91.4% |
| Median | 92.0% | 91.7% |
| Interquartile 25% (IQ1) | 90.4% | 89.5% |
| Interquartile 75% (IQ3) | 94.0% | 94.2% |
| Interquartile Range (IQR) | 3.6% | 4.7% |
| Standard Deviation (Sample) | 5.8% | 4.8% |
| Standard Deviation (Population) | 5.7% | 4.7% |
Similar Demographics by 11th Grade
Demographics Similar to Fijians by 11th Grade
In terms of 11th grade, the demographic groups most similar to Fijians are Immigrants from Vietnam (90.0%, a difference of 0.020%), Navajo (90.0%, a difference of 0.040%), Immigrants from Fiji (89.9%, a difference of 0.11%), Immigrants from Grenada (90.1%, a difference of 0.12%), and Japanese (89.9%, a difference of 0.14%).
| Demographics | Rating | Rank | 11th Grade |
| British West Indians | 0.0 /100 | #289 | Tragic 90.3% |
| Indonesians | 0.0 /100 | #290 | Tragic 90.3% |
| Haitians | 0.0 /100 | #291 | Tragic 90.3% |
| Cubans | 0.0 /100 | #292 | Tragic 90.2% |
| Natives/Alaskans | 0.0 /100 | #293 | Tragic 90.2% |
| Immigrants | Grenada | 0.0 /100 | #294 | Tragic 90.1% |
| Immigrants | Vietnam | 0.0 /100 | #295 | Tragic 90.0% |
| Fijians | 0.0 /100 | #296 | Tragic 90.0% |
| Navajo | 0.0 /100 | #297 | Tragic 90.0% |
| Immigrants | Fiji | 0.0 /100 | #298 | Tragic 89.9% |
| Japanese | 0.0 /100 | #299 | Tragic 89.9% |
| Immigrants | Haiti | 0.0 /100 | #300 | Tragic 89.9% |
| Guyanese | 0.0 /100 | #301 | Tragic 89.9% |
| Immigrants | Guyana | 0.0 /100 | #302 | Tragic 89.7% |
| Immigrants | Immigrants | 0.0 /100 | #303 | Tragic 89.7% |
Demographics Similar to Immigrants from Peru by 11th Grade
In terms of 11th grade, the demographic groups most similar to Immigrants from Peru are West Indian (91.0%, a difference of 0.0%), Trinidadian and Tobagonian (91.1%, a difference of 0.030%), Paiute (91.0%, a difference of 0.050%), Ute (91.1%, a difference of 0.060%), and U.S. Virgin Islander (91.1%, a difference of 0.090%).
| Demographics | Rating | Rank | 11th Grade |
| Yup'ik | 0.3 /100 | #264 | Tragic 91.2% |
| Pueblo | 0.3 /100 | #265 | Tragic 91.2% |
| Immigrants | Western Africa | 0.3 /100 | #266 | Tragic 91.2% |
| Immigrants | Jamaica | 0.3 /100 | #267 | Tragic 91.2% |
| U.S. Virgin Islanders | 0.2 /100 | #268 | Tragic 91.1% |
| Ute | 0.2 /100 | #269 | Tragic 91.1% |
| Trinidadians and Tobagonians | 0.2 /100 | #270 | Tragic 91.1% |
| Immigrants | Peru | 0.1 /100 | #271 | Tragic 91.0% |
| West Indians | 0.1 /100 | #272 | Tragic 91.0% |
| Paiute | 0.1 /100 | #273 | Tragic 91.0% |
| Immigrants | Trinidad and Tobago | 0.1 /100 | #274 | Tragic 90.9% |
| Immigrants | South Eastern Asia | 0.1 /100 | #275 | Tragic 90.9% |
| Bangladeshis | 0.1 /100 | #276 | Tragic 90.9% |
| Immigrants | Congo | 0.1 /100 | #277 | Tragic 90.9% |
| Malaysians | 0.1 /100 | #278 | Tragic 90.8% |