Armenian vs Immigrants from Armenia 11th Grade
COMPARE
Armenian
Immigrants from Armenia
11th Grade
11th Grade Comparison
Armenians
Immigrants from Armenia
91.7%
11TH GRADE
2.9/ 100
METRIC RATING
234th/ 347
METRIC RANK
88.8%
11TH GRADE
0.0/ 100
METRIC RATING
320th/ 347
METRIC RANK
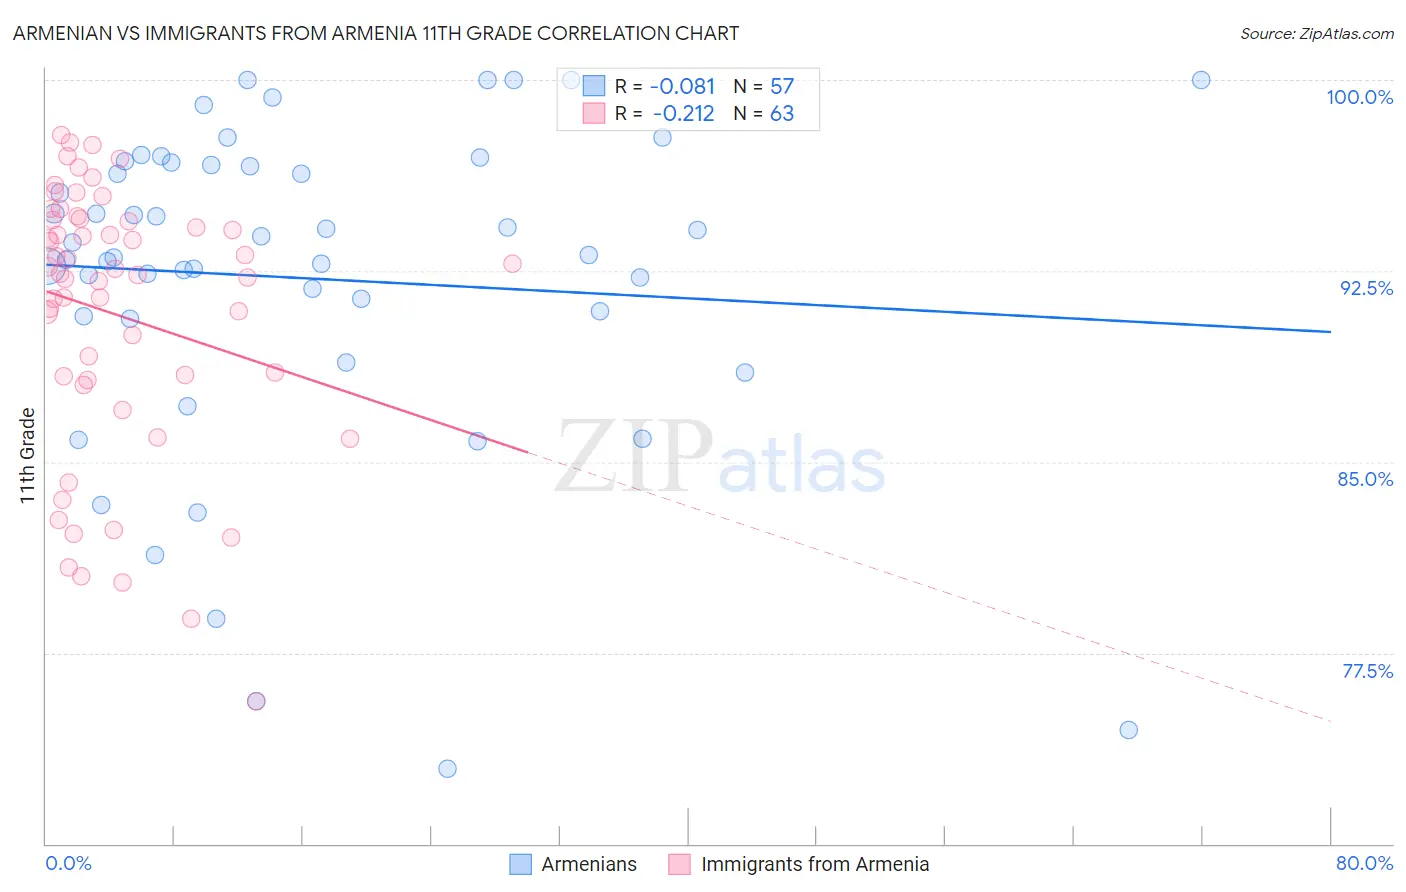
Armenian vs Immigrants from Armenia 11th Grade Correlation Chart
The statistical analysis conducted on geographies consisting of 310,954,801 people shows a slight negative correlation between the proportion of Armenians and percentage of population with at least 11th grade education in the United States with a correlation coefficient (R) of -0.081 and weighted average of 91.7%. Similarly, the statistical analysis conducted on geographies consisting of 97,657,339 people shows a weak negative correlation between the proportion of Immigrants from Armenia and percentage of population with at least 11th grade education in the United States with a correlation coefficient (R) of -0.212 and weighted average of 88.8%, a difference of 3.3%.
11th Grade Correlation Summary
| Measurement | Armenian | Immigrants from Armenia |
| Minimum | 73.0% | 75.6% |
| Maximum | 100.0% | 97.8% |
| Range | 27.0% | 22.2% |
| Mean | 92.2% | 90.8% |
| Median | 93.1% | 92.4% |
| Interquartile 25% (IQ1) | 90.7% | 88.2% |
| Interquartile 75% (IQ3) | 96.7% | 94.5% |
| Interquartile Range (IQR) | 6.0% | 6.3% |
| Standard Deviation (Sample) | 6.4% | 5.3% |
| Standard Deviation (Population) | 6.4% | 5.3% |
Similar Demographics by 11th Grade
Demographics Similar to Armenians by 11th Grade
In terms of 11th grade, the demographic groups most similar to Armenians are Subsaharan African (91.7%, a difference of 0.0%), Colombian (91.7%, a difference of 0.010%), Immigrants from Bolivia (91.7%, a difference of 0.010%), Cheyenne (91.8%, a difference of 0.030%), and Comanche (91.7%, a difference of 0.030%).
| Demographics | Rating | Rank | 11th Grade |
| Immigrants | Cameroon | 4.4 /100 | #227 | Tragic 91.8% |
| Immigrants | Panama | 4.3 /100 | #228 | Tragic 91.8% |
| Nigerians | 4.3 /100 | #229 | Tragic 91.8% |
| Immigrants | Afghanistan | 3.9 /100 | #230 | Tragic 91.8% |
| Choctaw | 3.7 /100 | #231 | Tragic 91.8% |
| Uruguayans | 3.5 /100 | #232 | Tragic 91.8% |
| Cheyenne | 3.3 /100 | #233 | Tragic 91.8% |
| Armenians | 2.9 /100 | #234 | Tragic 91.7% |
| Sub-Saharan Africans | 2.9 /100 | #235 | Tragic 91.7% |
| Colombians | 2.8 /100 | #236 | Tragic 91.7% |
| Immigrants | Bolivia | 2.8 /100 | #237 | Tragic 91.7% |
| Comanche | 2.6 /100 | #238 | Tragic 91.7% |
| Hopi | 2.5 /100 | #239 | Tragic 91.7% |
| South Americans | 2.0 /100 | #240 | Tragic 91.6% |
| Bahamians | 1.8 /100 | #241 | Tragic 91.6% |
Demographics Similar to Immigrants from Armenia by 11th Grade
In terms of 11th grade, the demographic groups most similar to Immigrants from Armenia are Belizean (88.8%, a difference of 0.020%), Immigrants from Belize (88.7%, a difference of 0.090%), Nicaraguan (88.9%, a difference of 0.11%), Lumbee (88.9%, a difference of 0.17%), and Immigrants from Cuba (88.9%, a difference of 0.18%).
| Demographics | Rating | Rank | 11th Grade |
| Immigrants | Caribbean | 0.0 /100 | #313 | Tragic 89.1% |
| Cape Verdeans | 0.0 /100 | #314 | Tragic 89.1% |
| Immigrants | Ecuador | 0.0 /100 | #315 | Tragic 89.1% |
| Immigrants | Cuba | 0.0 /100 | #316 | Tragic 88.9% |
| Lumbee | 0.0 /100 | #317 | Tragic 88.9% |
| Nicaraguans | 0.0 /100 | #318 | Tragic 88.9% |
| Belizeans | 0.0 /100 | #319 | Tragic 88.8% |
| Immigrants | Armenia | 0.0 /100 | #320 | Tragic 88.8% |
| Immigrants | Belize | 0.0 /100 | #321 | Tragic 88.7% |
| Puerto Ricans | 0.0 /100 | #322 | Tragic 88.4% |
| Pima | 0.0 /100 | #323 | Tragic 88.3% |
| Central American Indians | 0.0 /100 | #324 | Tragic 88.2% |
| Immigrants | Nicaragua | 0.0 /100 | #325 | Tragic 88.1% |
| Dominicans | 0.0 /100 | #326 | Tragic 87.7% |
| Immigrants | Cabo Verde | 0.0 /100 | #327 | Tragic 87.6% |