European vs Moroccan No Schooling Completed
COMPARE
European
Moroccan
No Schooling Completed
No Schooling Completed Comparison
Europeans
Moroccans
1.5%
NO SCHOOLING COMPLETED
100.0/ 100
METRIC RATING
23rd/ 347
METRIC RANK
2.2%
NO SCHOOLING COMPLETED
13.7/ 100
METRIC RATING
202nd/ 347
METRIC RANK
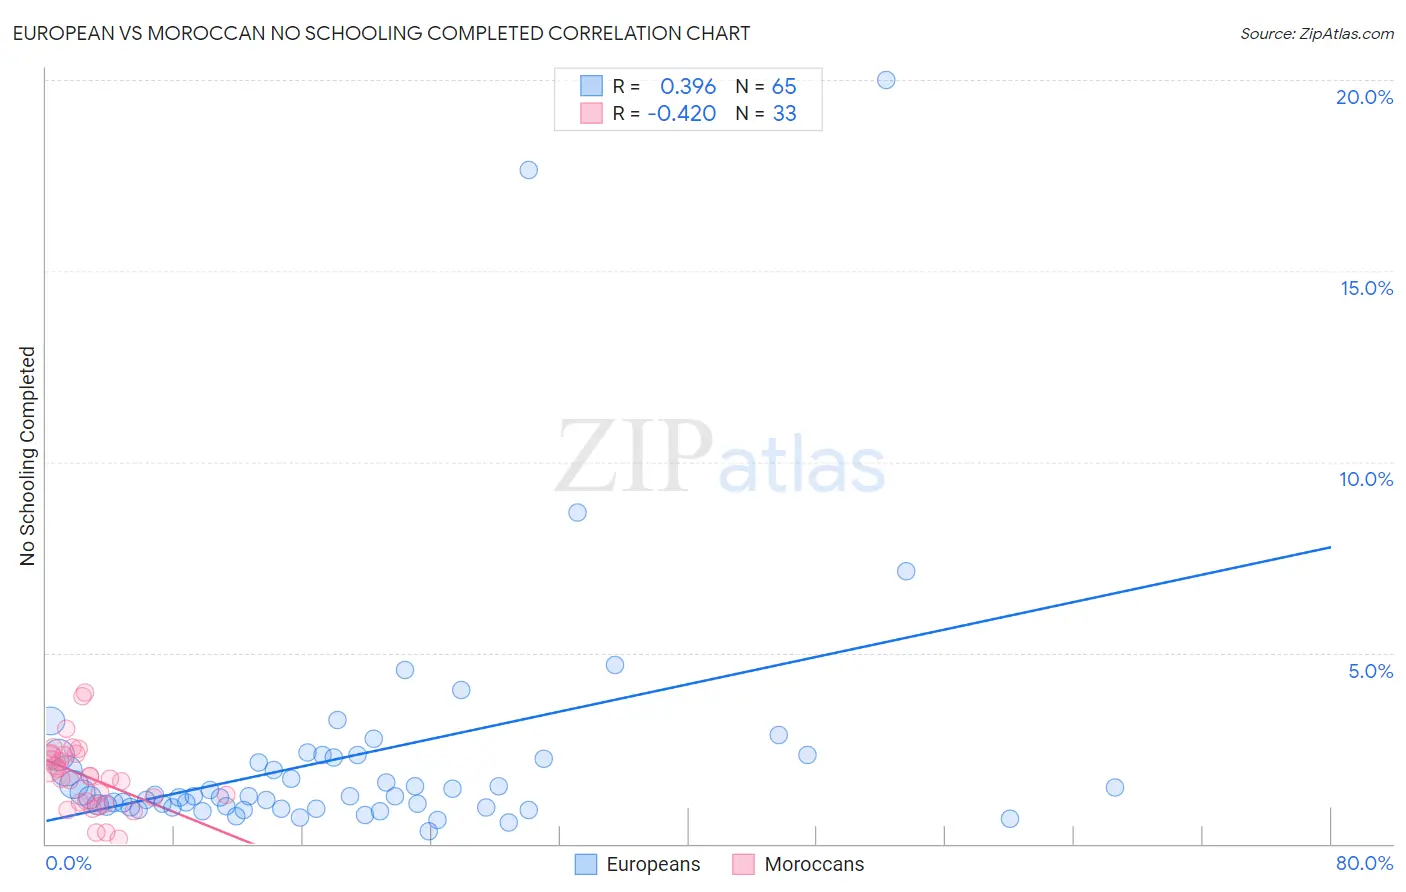
European vs Moroccan No Schooling Completed Correlation Chart
The statistical analysis conducted on geographies consisting of 544,915,278 people shows a mild positive correlation between the proportion of Europeans and percentage of population with no schooling in the United States with a correlation coefficient (R) of 0.396 and weighted average of 1.5%. Similarly, the statistical analysis conducted on geographies consisting of 201,160,472 people shows a moderate negative correlation between the proportion of Moroccans and percentage of population with no schooling in the United States with a correlation coefficient (R) of -0.420 and weighted average of 2.2%, a difference of 50.2%.
No Schooling Completed Correlation Summary
| Measurement | European | Moroccan |
| Minimum | 0.31% | 0.12% |
| Maximum | 20.0% | 4.0% |
| Range | 19.7% | 3.8% |
| Mean | 2.3% | 1.7% |
| Median | 1.2% | 1.7% |
| Interquartile 25% (IQ1) | 0.96% | 1.1% |
| Interquartile 75% (IQ3) | 2.3% | 2.3% |
| Interquartile Range (IQR) | 1.3% | 1.3% |
| Standard Deviation (Sample) | 3.3% | 0.90% |
| Standard Deviation (Population) | 3.3% | 0.89% |
Similar Demographics by No Schooling Completed
Demographics Similar to Europeans by No Schooling Completed
In terms of no schooling completed, the demographic groups most similar to Europeans are Alaska Native (1.5%, a difference of 0.25%), Chinese (1.5%, a difference of 0.34%), Pennsylvania German (1.5%, a difference of 0.35%), French (1.5%, a difference of 0.37%), and Welsh (1.5%, a difference of 0.71%).
| Demographics | Rating | Rank | No Schooling Completed |
| Finns | 100.0 /100 | #16 | Exceptional 1.5% |
| Croatians | 100.0 /100 | #17 | Exceptional 1.5% |
| Danes | 100.0 /100 | #18 | Exceptional 1.5% |
| Alaskan Athabascans | 100.0 /100 | #19 | Exceptional 1.5% |
| Welsh | 100.0 /100 | #20 | Exceptional 1.5% |
| Chinese | 100.0 /100 | #21 | Exceptional 1.5% |
| Alaska Natives | 100.0 /100 | #22 | Exceptional 1.5% |
| Europeans | 100.0 /100 | #23 | Exceptional 1.5% |
| Pennsylvania Germans | 100.0 /100 | #24 | Exceptional 1.5% |
| French | 100.0 /100 | #25 | Exceptional 1.5% |
| Czechs | 100.0 /100 | #26 | Exceptional 1.5% |
| Scandinavians | 100.0 /100 | #27 | Exceptional 1.5% |
| French Canadians | 100.0 /100 | #28 | Exceptional 1.5% |
| Lumbee | 100.0 /100 | #29 | Exceptional 1.5% |
| British | 100.0 /100 | #30 | Exceptional 1.5% |
Demographics Similar to Moroccans by No Schooling Completed
In terms of no schooling completed, the demographic groups most similar to Moroccans are Laotian (2.2%, a difference of 0.11%), Hopi (2.2%, a difference of 0.22%), Immigrants from Bahamas (2.2%, a difference of 0.62%), Bahamian (2.2%, a difference of 0.63%), and South American Indian (2.2%, a difference of 0.81%).
| Demographics | Rating | Rank | No Schooling Completed |
| Hawaiians | 27.0 /100 | #195 | Fair 2.2% |
| Immigrants | Ukraine | 26.1 /100 | #196 | Fair 2.2% |
| Immigrants | Southern Europe | 23.8 /100 | #197 | Fair 2.2% |
| Immigrants | Chile | 22.7 /100 | #198 | Fair 2.2% |
| Africans | 21.8 /100 | #199 | Fair 2.2% |
| Immigrants | Northern Africa | 19.5 /100 | #200 | Poor 2.2% |
| Costa Ricans | 17.1 /100 | #201 | Poor 2.2% |
| Moroccans | 13.7 /100 | #202 | Poor 2.2% |
| Laotians | 13.3 /100 | #203 | Poor 2.2% |
| Hopi | 12.9 /100 | #204 | Poor 2.2% |
| Immigrants | Bahamas | 11.6 /100 | #205 | Poor 2.2% |
| Bahamians | 11.6 /100 | #206 | Poor 2.2% |
| South American Indians | 11.0 /100 | #207 | Poor 2.2% |
| Uruguayans | 11.0 /100 | #208 | Poor 2.2% |
| Immigrants | Oceania | 10.2 /100 | #209 | Poor 2.2% |