Estonian vs Welsh Kindergarten
COMPARE
Estonian
Welsh
Kindergarten
Kindergarten Comparison
Estonians
Welsh
98.4%
KINDERGARTEN
99.8/ 100
METRIC RATING
51st/ 347
METRIC RANK
98.9%
KINDERGARTEN
100.0/ 100
METRIC RATING
4th/ 347
METRIC RANK
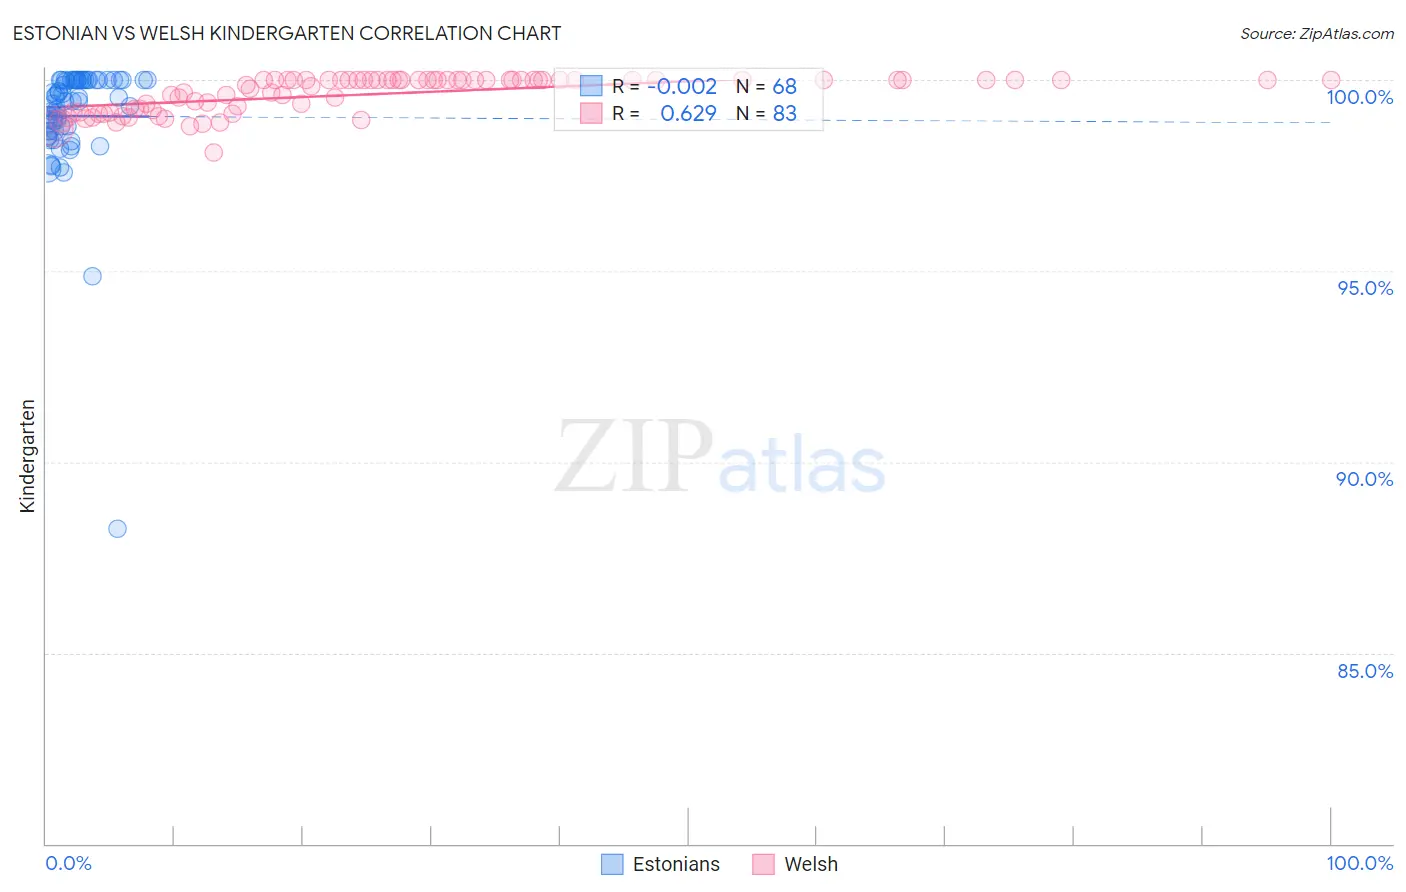
Estonian vs Welsh Kindergarten Correlation Chart
The statistical analysis conducted on geographies consisting of 123,528,404 people shows no correlation between the proportion of Estonians and percentage of population with at least kindergarten education in the United States with a correlation coefficient (R) of -0.002 and weighted average of 98.4%. Similarly, the statistical analysis conducted on geographies consisting of 239,962,401 people shows a significant positive correlation between the proportion of Welsh and percentage of population with at least kindergarten education in the United States with a correlation coefficient (R) of 0.629 and weighted average of 98.9%, a difference of 0.46%.
Kindergarten Correlation Summary
| Measurement | Estonian | Welsh |
| Minimum | 88.3% | 98.1% |
| Maximum | 100.0% | 100.0% |
| Range | 11.7% | 1.9% |
| Mean | 99.1% | 99.6% |
| Median | 99.4% | 100.0% |
| Interquartile 25% (IQ1) | 98.7% | 99.2% |
| Interquartile 75% (IQ3) | 100.0% | 100.0% |
| Interquartile Range (IQR) | 1.3% | 0.84% |
| Standard Deviation (Sample) | 1.6% | 0.46% |
| Standard Deviation (Population) | 1.6% | 0.46% |
Similar Demographics by Kindergarten
Demographics Similar to Estonians by Kindergarten
In terms of kindergarten, the demographic groups most similar to Estonians are Kiowa (98.4%, a difference of 0.0%), White/Caucasian (98.4%, a difference of 0.0%), Australian (98.4%, a difference of 0.0%), Celtic (98.4%, a difference of 0.0%), and Pueblo (98.4%, a difference of 0.0%).
| Demographics | Rating | Rank | Kindergarten |
| Northern Europeans | 99.9 /100 | #44 | Exceptional 98.5% |
| Belgians | 99.9 /100 | #45 | Exceptional 98.5% |
| Hungarians | 99.9 /100 | #46 | Exceptional 98.5% |
| Czechoslovakians | 99.8 /100 | #47 | Exceptional 98.4% |
| Ottawa | 99.8 /100 | #48 | Exceptional 98.4% |
| Kiowa | 99.8 /100 | #49 | Exceptional 98.4% |
| Whites/Caucasians | 99.8 /100 | #50 | Exceptional 98.4% |
| Estonians | 99.8 /100 | #51 | Exceptional 98.4% |
| Australians | 99.8 /100 | #52 | Exceptional 98.4% |
| Celtics | 99.8 /100 | #53 | Exceptional 98.4% |
| Pueblo | 99.8 /100 | #54 | Exceptional 98.4% |
| Immigrants | Scotland | 99.8 /100 | #55 | Exceptional 98.4% |
| Americans | 99.8 /100 | #56 | Exceptional 98.4% |
| Austrians | 99.8 /100 | #57 | Exceptional 98.4% |
| Bulgarians | 99.7 /100 | #58 | Exceptional 98.4% |
Demographics Similar to Welsh by Kindergarten
In terms of kindergarten, the demographic groups most similar to Welsh are Inupiat (98.9%, a difference of 0.010%), Tsimshian (98.8%, a difference of 0.020%), Alaskan Athabascan (98.8%, a difference of 0.090%), Alaska Native (98.7%, a difference of 0.13%), and Norwegian (98.7%, a difference of 0.15%).
| Demographics | Rating | Rank | Kindergarten |
| Crow | 100.0 /100 | #1 | Exceptional 99.7% |
| Yup'ik | 100.0 /100 | #2 | Exceptional 99.2% |
| Inupiat | 100.0 /100 | #3 | Exceptional 98.9% |
| Welsh | 100.0 /100 | #4 | Exceptional 98.9% |
| Tsimshian | 100.0 /100 | #5 | Exceptional 98.8% |
| Alaskan Athabascans | 100.0 /100 | #6 | Exceptional 98.8% |
| Alaska Natives | 100.0 /100 | #7 | Exceptional 98.7% |
| Norwegians | 100.0 /100 | #8 | Exceptional 98.7% |
| Tlingit-Haida | 100.0 /100 | #9 | Exceptional 98.7% |
| Slovaks | 100.0 /100 | #10 | Exceptional 98.7% |
| Germans | 100.0 /100 | #11 | Exceptional 98.7% |
| Slovenes | 100.0 /100 | #12 | Exceptional 98.7% |
| Carpatho Rusyns | 100.0 /100 | #13 | Exceptional 98.7% |
| English | 100.0 /100 | #14 | Exceptional 98.7% |
| Swedes | 100.0 /100 | #15 | Exceptional 98.7% |