Turkish vs Welsh Kindergarten
COMPARE
Turkish
Welsh
Kindergarten
Kindergarten Comparison
Turks
Welsh
98.2%
KINDERGARTEN
97.3/ 100
METRIC RATING
107th/ 347
METRIC RANK
98.9%
KINDERGARTEN
100.0/ 100
METRIC RATING
4th/ 347
METRIC RANK
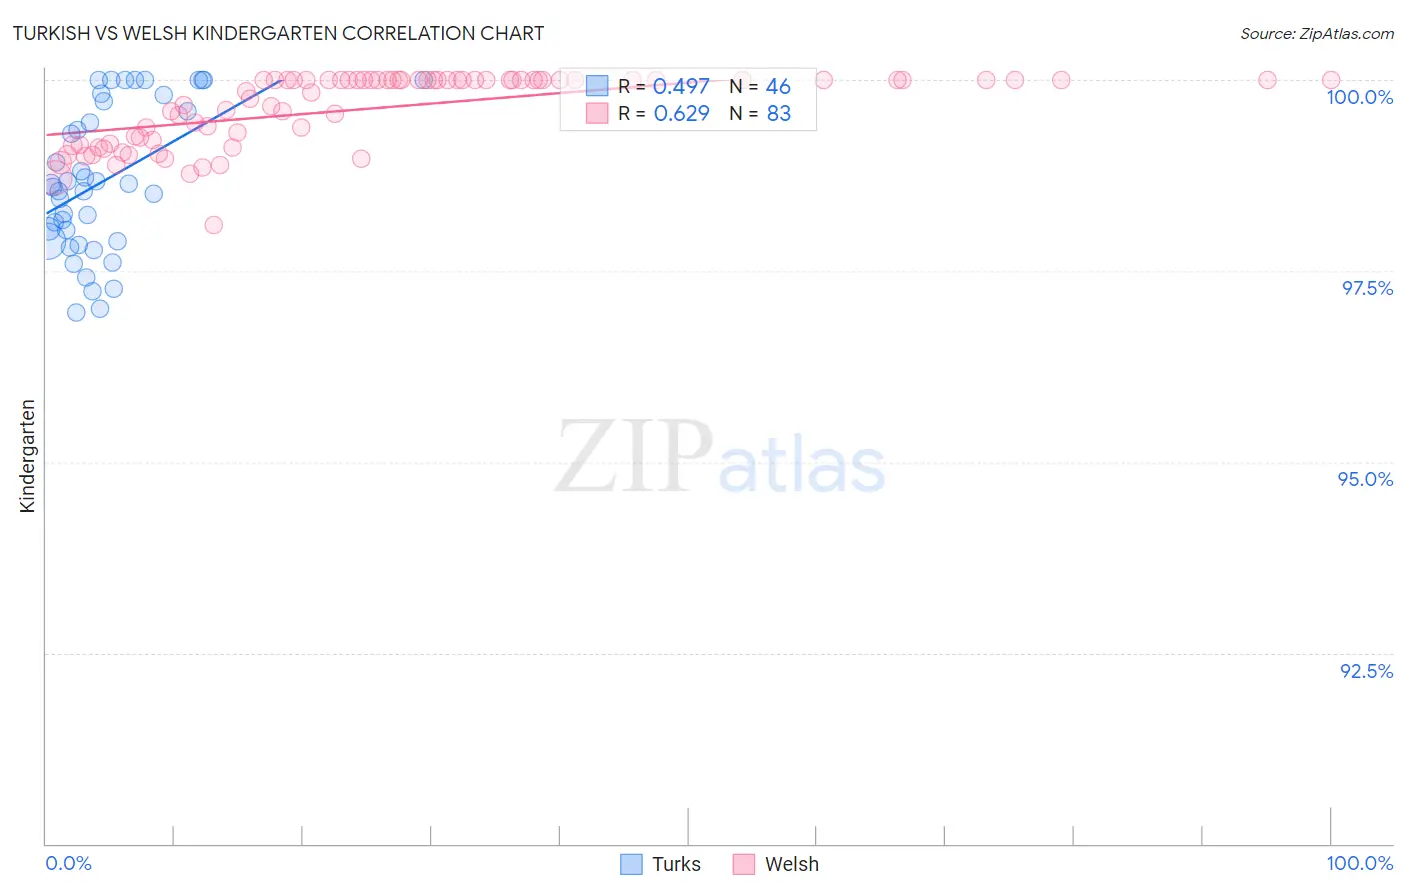
Turkish vs Welsh Kindergarten Correlation Chart
The statistical analysis conducted on geographies consisting of 271,858,657 people shows a moderate positive correlation between the proportion of Turks and percentage of population with at least kindergarten education in the United States with a correlation coefficient (R) of 0.497 and weighted average of 98.2%. Similarly, the statistical analysis conducted on geographies consisting of 239,962,401 people shows a significant positive correlation between the proportion of Welsh and percentage of population with at least kindergarten education in the United States with a correlation coefficient (R) of 0.629 and weighted average of 98.9%, a difference of 0.66%.
Kindergarten Correlation Summary
| Measurement | Turkish | Welsh |
| Minimum | 97.0% | 98.1% |
| Maximum | 100.0% | 100.0% |
| Range | 3.0% | 1.9% |
| Mean | 98.7% | 99.6% |
| Median | 98.6% | 100.0% |
| Interquartile 25% (IQ1) | 97.9% | 99.2% |
| Interquartile 75% (IQ3) | 99.7% | 100.0% |
| Interquartile Range (IQR) | 1.8% | 0.84% |
| Standard Deviation (Sample) | 0.95% | 0.46% |
| Standard Deviation (Population) | 0.94% | 0.46% |
Similar Demographics by Kindergarten
Demographics Similar to Turks by Kindergarten
In terms of kindergarten, the demographic groups most similar to Turks are Bhutanese (98.2%, a difference of 0.0%), Pima (98.2%, a difference of 0.0%), Basque (98.2%, a difference of 0.0%), Immigrants from Switzerland (98.2%, a difference of 0.0%), and Cree (98.2%, a difference of 0.010%).
| Demographics | Rating | Rank | Kindergarten |
| Puget Sound Salish | 98.1 /100 | #100 | Exceptional 98.2% |
| Romanians | 97.8 /100 | #101 | Exceptional 98.2% |
| Cree | 97.7 /100 | #102 | Exceptional 98.2% |
| Immigrants | Ireland | 97.6 /100 | #103 | Exceptional 98.2% |
| Bhutanese | 97.3 /100 | #104 | Exceptional 98.2% |
| Pima | 97.3 /100 | #105 | Exceptional 98.2% |
| Basques | 97.3 /100 | #106 | Exceptional 98.2% |
| Turks | 97.3 /100 | #107 | Exceptional 98.2% |
| Immigrants | Switzerland | 97.2 /100 | #108 | Exceptional 98.2% |
| German Russians | 97.1 /100 | #109 | Exceptional 98.2% |
| Immigrants | Singapore | 96.8 /100 | #110 | Exceptional 98.2% |
| Immigrants | Norway | 96.6 /100 | #111 | Exceptional 98.2% |
| Immigrants | Czechoslovakia | 96.6 /100 | #112 | Exceptional 98.2% |
| Immigrants | Latvia | 96.3 /100 | #113 | Exceptional 98.2% |
| Ute | 96.3 /100 | #114 | Exceptional 98.2% |
Demographics Similar to Welsh by Kindergarten
In terms of kindergarten, the demographic groups most similar to Welsh are Inupiat (98.9%, a difference of 0.010%), Tsimshian (98.8%, a difference of 0.020%), Alaskan Athabascan (98.8%, a difference of 0.090%), Alaska Native (98.7%, a difference of 0.13%), and Norwegian (98.7%, a difference of 0.15%).
| Demographics | Rating | Rank | Kindergarten |
| Crow | 100.0 /100 | #1 | Exceptional 99.7% |
| Yup'ik | 100.0 /100 | #2 | Exceptional 99.2% |
| Inupiat | 100.0 /100 | #3 | Exceptional 98.9% |
| Welsh | 100.0 /100 | #4 | Exceptional 98.9% |
| Tsimshian | 100.0 /100 | #5 | Exceptional 98.8% |
| Alaskan Athabascans | 100.0 /100 | #6 | Exceptional 98.8% |
| Alaska Natives | 100.0 /100 | #7 | Exceptional 98.7% |
| Norwegians | 100.0 /100 | #8 | Exceptional 98.7% |
| Tlingit-Haida | 100.0 /100 | #9 | Exceptional 98.7% |
| Slovaks | 100.0 /100 | #10 | Exceptional 98.7% |
| Germans | 100.0 /100 | #11 | Exceptional 98.7% |
| Slovenes | 100.0 /100 | #12 | Exceptional 98.7% |
| Carpatho Rusyns | 100.0 /100 | #13 | Exceptional 98.7% |
| English | 100.0 /100 | #14 | Exceptional 98.7% |
| Swedes | 100.0 /100 | #15 | Exceptional 98.7% |