Estonian vs Houma Kindergarten
COMPARE
Estonian
Houma
Kindergarten
Kindergarten Comparison
Estonians
Houma
98.4%
KINDERGARTEN
99.8/ 100
METRIC RATING
51st/ 347
METRIC RANK
97.3%
KINDERGARTEN
0.0/ 100
METRIC RATING
291st/ 347
METRIC RANK
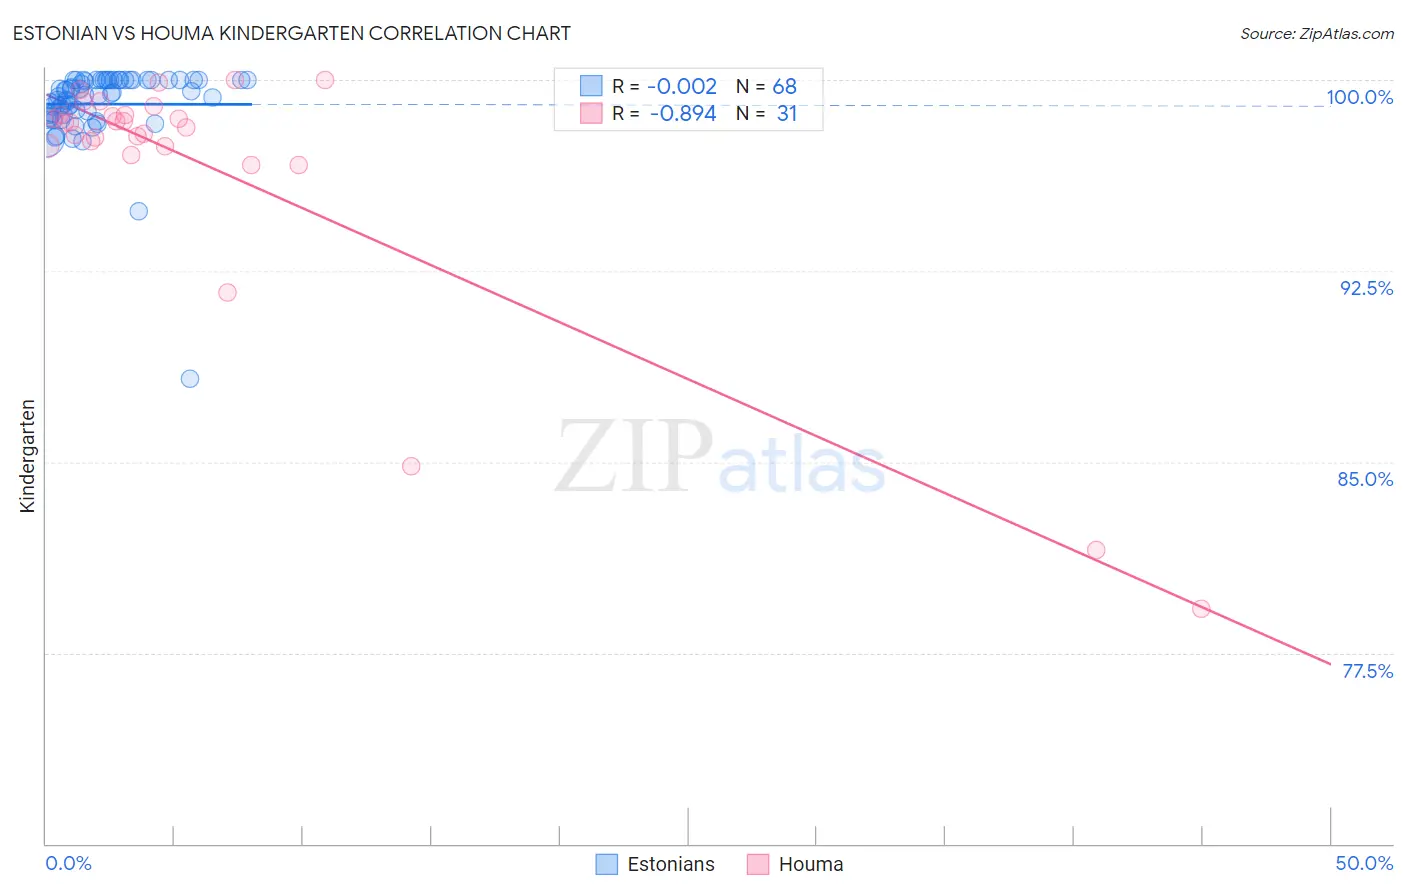
Estonian vs Houma Kindergarten Correlation Chart
The statistical analysis conducted on geographies consisting of 123,528,404 people shows no correlation between the proportion of Estonians and percentage of population with at least kindergarten education in the United States with a correlation coefficient (R) of -0.002 and weighted average of 98.4%. Similarly, the statistical analysis conducted on geographies consisting of 36,795,916 people shows a very strong negative correlation between the proportion of Houma and percentage of population with at least kindergarten education in the United States with a correlation coefficient (R) of -0.894 and weighted average of 97.3%, a difference of 1.2%.
Kindergarten Correlation Summary
| Measurement | Estonian | Houma |
| Minimum | 88.3% | 79.2% |
| Maximum | 100.0% | 100.0% |
| Range | 11.7% | 20.8% |
| Mean | 99.1% | 96.5% |
| Median | 99.4% | 98.3% |
| Interquartile 25% (IQ1) | 98.7% | 97.4% |
| Interquartile 75% (IQ3) | 100.0% | 98.6% |
| Interquartile Range (IQR) | 1.3% | 1.2% |
| Standard Deviation (Sample) | 1.6% | 5.1% |
| Standard Deviation (Population) | 1.6% | 5.1% |
Similar Demographics by Kindergarten
Demographics Similar to Estonians by Kindergarten
In terms of kindergarten, the demographic groups most similar to Estonians are Kiowa (98.4%, a difference of 0.0%), White/Caucasian (98.4%, a difference of 0.0%), Australian (98.4%, a difference of 0.0%), Celtic (98.4%, a difference of 0.0%), and Pueblo (98.4%, a difference of 0.0%).
| Demographics | Rating | Rank | Kindergarten |
| Northern Europeans | 99.9 /100 | #44 | Exceptional 98.5% |
| Belgians | 99.9 /100 | #45 | Exceptional 98.5% |
| Hungarians | 99.9 /100 | #46 | Exceptional 98.5% |
| Czechoslovakians | 99.8 /100 | #47 | Exceptional 98.4% |
| Ottawa | 99.8 /100 | #48 | Exceptional 98.4% |
| Kiowa | 99.8 /100 | #49 | Exceptional 98.4% |
| Whites/Caucasians | 99.8 /100 | #50 | Exceptional 98.4% |
| Estonians | 99.8 /100 | #51 | Exceptional 98.4% |
| Australians | 99.8 /100 | #52 | Exceptional 98.4% |
| Celtics | 99.8 /100 | #53 | Exceptional 98.4% |
| Pueblo | 99.8 /100 | #54 | Exceptional 98.4% |
| Immigrants | Scotland | 99.8 /100 | #55 | Exceptional 98.4% |
| Americans | 99.8 /100 | #56 | Exceptional 98.4% |
| Austrians | 99.8 /100 | #57 | Exceptional 98.4% |
| Bulgarians | 99.7 /100 | #58 | Exceptional 98.4% |
Demographics Similar to Houma by Kindergarten
In terms of kindergarten, the demographic groups most similar to Houma are British West Indian (97.3%, a difference of 0.010%), Immigrants from St. Vincent and the Grenadines (97.3%, a difference of 0.020%), Immigrants from Afghanistan (97.3%, a difference of 0.030%), Malaysian (97.2%, a difference of 0.030%), and Immigrants from Thailand (97.3%, a difference of 0.050%).
| Demographics | Rating | Rank | Kindergarten |
| Immigrants | Trinidad and Tobago | 0.0 /100 | #284 | Tragic 97.3% |
| Immigrants | Portugal | 0.0 /100 | #285 | Tragic 97.3% |
| Immigrants | Barbados | 0.0 /100 | #286 | Tragic 97.3% |
| Immigrants | Hong Kong | 0.0 /100 | #287 | Tragic 97.3% |
| Immigrants | Thailand | 0.0 /100 | #288 | Tragic 97.3% |
| Immigrants | Afghanistan | 0.0 /100 | #289 | Tragic 97.3% |
| Immigrants | St. Vincent and the Grenadines | 0.0 /100 | #290 | Tragic 97.3% |
| Houma | 0.0 /100 | #291 | Tragic 97.3% |
| British West Indians | 0.0 /100 | #292 | Tragic 97.3% |
| Malaysians | 0.0 /100 | #293 | Tragic 97.2% |
| Immigrants | Immigrants | 0.0 /100 | #294 | Tragic 97.2% |
| Immigrants | Grenada | 0.0 /100 | #295 | Tragic 97.2% |
| Immigrants | Eritrea | 0.0 /100 | #296 | Tragic 97.2% |
| Central American Indians | 0.0 /100 | #297 | Tragic 97.2% |
| Immigrants | Dominica | 0.0 /100 | #298 | Tragic 97.1% |