Immigrants from Middle Africa vs Houma Kindergarten
COMPARE
Immigrants from Middle Africa
Houma
Kindergarten
Kindergarten Comparison
Immigrants from Middle Africa
Houma
97.6%
KINDERGARTEN
1.0/ 100
METRIC RATING
248th/ 347
METRIC RANK
97.3%
KINDERGARTEN
0.0/ 100
METRIC RATING
291st/ 347
METRIC RANK
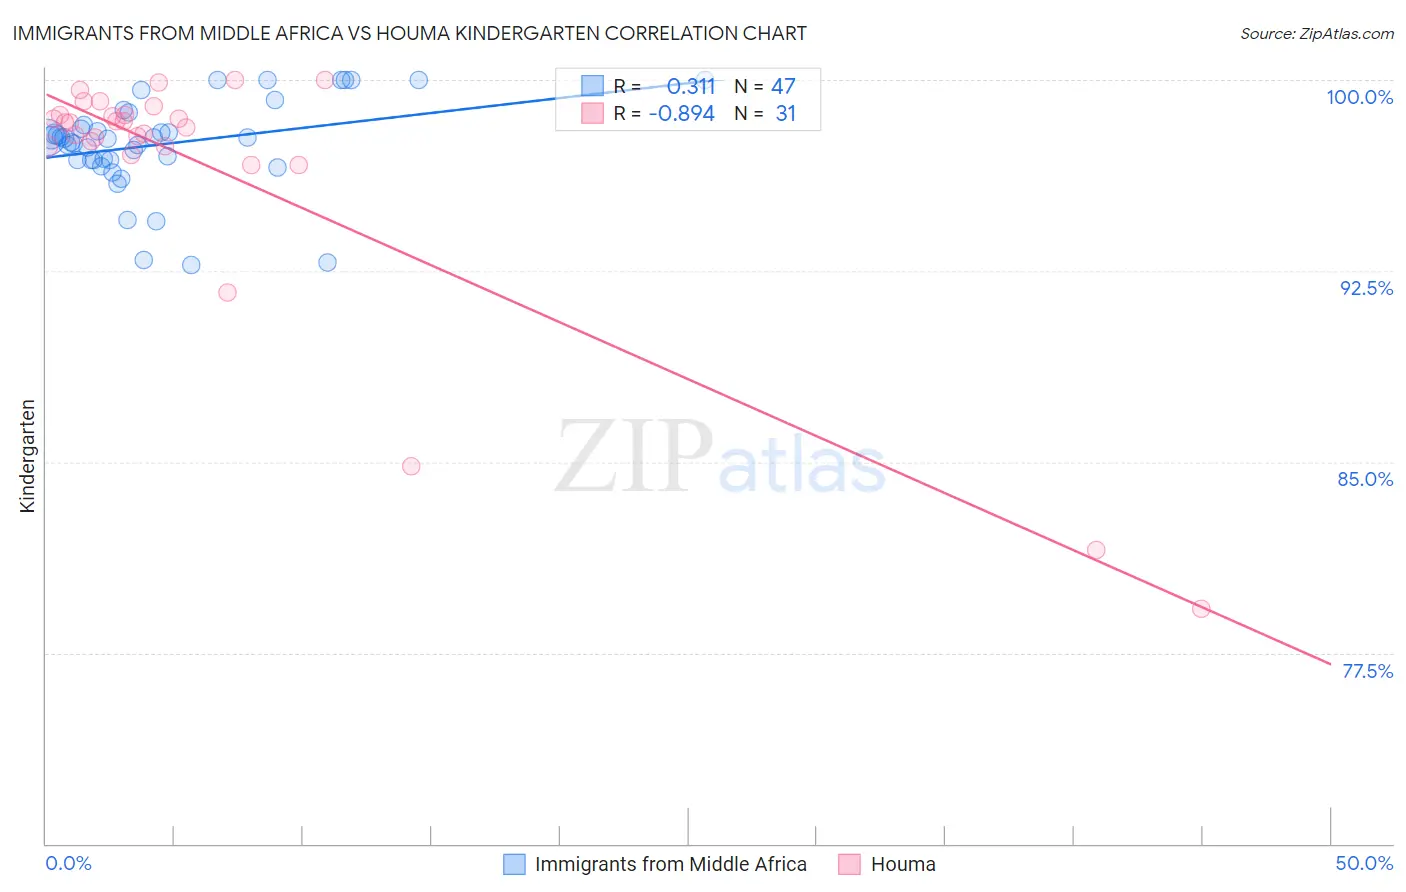
Immigrants from Middle Africa vs Houma Kindergarten Correlation Chart
The statistical analysis conducted on geographies consisting of 202,721,852 people shows a mild positive correlation between the proportion of Immigrants from Middle Africa and percentage of population with at least kindergarten education in the United States with a correlation coefficient (R) of 0.311 and weighted average of 97.6%. Similarly, the statistical analysis conducted on geographies consisting of 36,795,916 people shows a very strong negative correlation between the proportion of Houma and percentage of population with at least kindergarten education in the United States with a correlation coefficient (R) of -0.894 and weighted average of 97.3%, a difference of 0.35%.
Kindergarten Correlation Summary
| Measurement | Immigrants from Middle Africa | Houma |
| Minimum | 92.7% | 79.2% |
| Maximum | 100.0% | 100.0% |
| Range | 7.3% | 20.8% |
| Mean | 97.5% | 96.5% |
| Median | 97.7% | 98.3% |
| Interquartile 25% (IQ1) | 96.8% | 97.4% |
| Interquartile 75% (IQ3) | 98.2% | 98.6% |
| Interquartile Range (IQR) | 1.4% | 1.2% |
| Standard Deviation (Sample) | 1.8% | 5.1% |
| Standard Deviation (Population) | 1.8% | 5.1% |
Similar Demographics by Kindergarten
Demographics Similar to Immigrants from Middle Africa by Kindergarten
In terms of kindergarten, the demographic groups most similar to Immigrants from Middle Africa are South American (97.6%, a difference of 0.0%), Indian (Asian) (97.6%, a difference of 0.0%), Immigrants from Eastern Africa (97.6%, a difference of 0.0%), Peruvian (97.6%, a difference of 0.0%), and Asian (97.6%, a difference of 0.010%).
| Demographics | Rating | Rank | Kindergarten |
| Liberians | 1.3 /100 | #241 | Tragic 97.6% |
| Immigrants | Indonesia | 1.3 /100 | #242 | Tragic 97.6% |
| Asians | 1.2 /100 | #243 | Tragic 97.6% |
| Bolivians | 1.2 /100 | #244 | Tragic 97.6% |
| South Americans | 1.1 /100 | #245 | Tragic 97.6% |
| Indians (Asian) | 1.0 /100 | #246 | Tragic 97.6% |
| Immigrants | Eastern Africa | 1.0 /100 | #247 | Tragic 97.6% |
| Immigrants | Middle Africa | 1.0 /100 | #248 | Tragic 97.6% |
| Peruvians | 1.0 /100 | #249 | Tragic 97.6% |
| Immigrants | Senegal | 0.9 /100 | #250 | Tragic 97.6% |
| Ethiopians | 0.9 /100 | #251 | Tragic 97.6% |
| Immigrants | Iraq | 0.9 /100 | #252 | Tragic 97.6% |
| Immigrants | Africa | 0.8 /100 | #253 | Tragic 97.6% |
| Immigrants | Asia | 0.8 /100 | #254 | Tragic 97.6% |
| Immigrants | Congo | 0.8 /100 | #255 | Tragic 97.6% |
Demographics Similar to Houma by Kindergarten
In terms of kindergarten, the demographic groups most similar to Houma are British West Indian (97.3%, a difference of 0.010%), Immigrants from St. Vincent and the Grenadines (97.3%, a difference of 0.020%), Immigrants from Afghanistan (97.3%, a difference of 0.030%), Malaysian (97.2%, a difference of 0.030%), and Immigrants from Thailand (97.3%, a difference of 0.050%).
| Demographics | Rating | Rank | Kindergarten |
| Immigrants | Trinidad and Tobago | 0.0 /100 | #284 | Tragic 97.3% |
| Immigrants | Portugal | 0.0 /100 | #285 | Tragic 97.3% |
| Immigrants | Barbados | 0.0 /100 | #286 | Tragic 97.3% |
| Immigrants | Hong Kong | 0.0 /100 | #287 | Tragic 97.3% |
| Immigrants | Thailand | 0.0 /100 | #288 | Tragic 97.3% |
| Immigrants | Afghanistan | 0.0 /100 | #289 | Tragic 97.3% |
| Immigrants | St. Vincent and the Grenadines | 0.0 /100 | #290 | Tragic 97.3% |
| Houma | 0.0 /100 | #291 | Tragic 97.3% |
| British West Indians | 0.0 /100 | #292 | Tragic 97.3% |
| Malaysians | 0.0 /100 | #293 | Tragic 97.2% |
| Immigrants | Immigrants | 0.0 /100 | #294 | Tragic 97.2% |
| Immigrants | Grenada | 0.0 /100 | #295 | Tragic 97.2% |
| Immigrants | Eritrea | 0.0 /100 | #296 | Tragic 97.2% |
| Central American Indians | 0.0 /100 | #297 | Tragic 97.2% |
| Immigrants | Dominica | 0.0 /100 | #298 | Tragic 97.1% |