Egyptian vs Immigrants from Western Africa Unemployment Among Ages 25 to 29 years
COMPARE
Egyptian
Immigrants from Western Africa
Unemployment Among Ages 25 to 29 years
Unemployment Among Ages 25 to 29 years Comparison
Egyptians
Immigrants from Western Africa
6.4%
UNEMPLOYMENT AMONG AGES 25 TO 29 YEARS
93.9/ 100
METRIC RATING
91st/ 347
METRIC RANK
7.4%
UNEMPLOYMENT AMONG AGES 25 TO 29 YEARS
0.1/ 100
METRIC RATING
264th/ 347
METRIC RANK
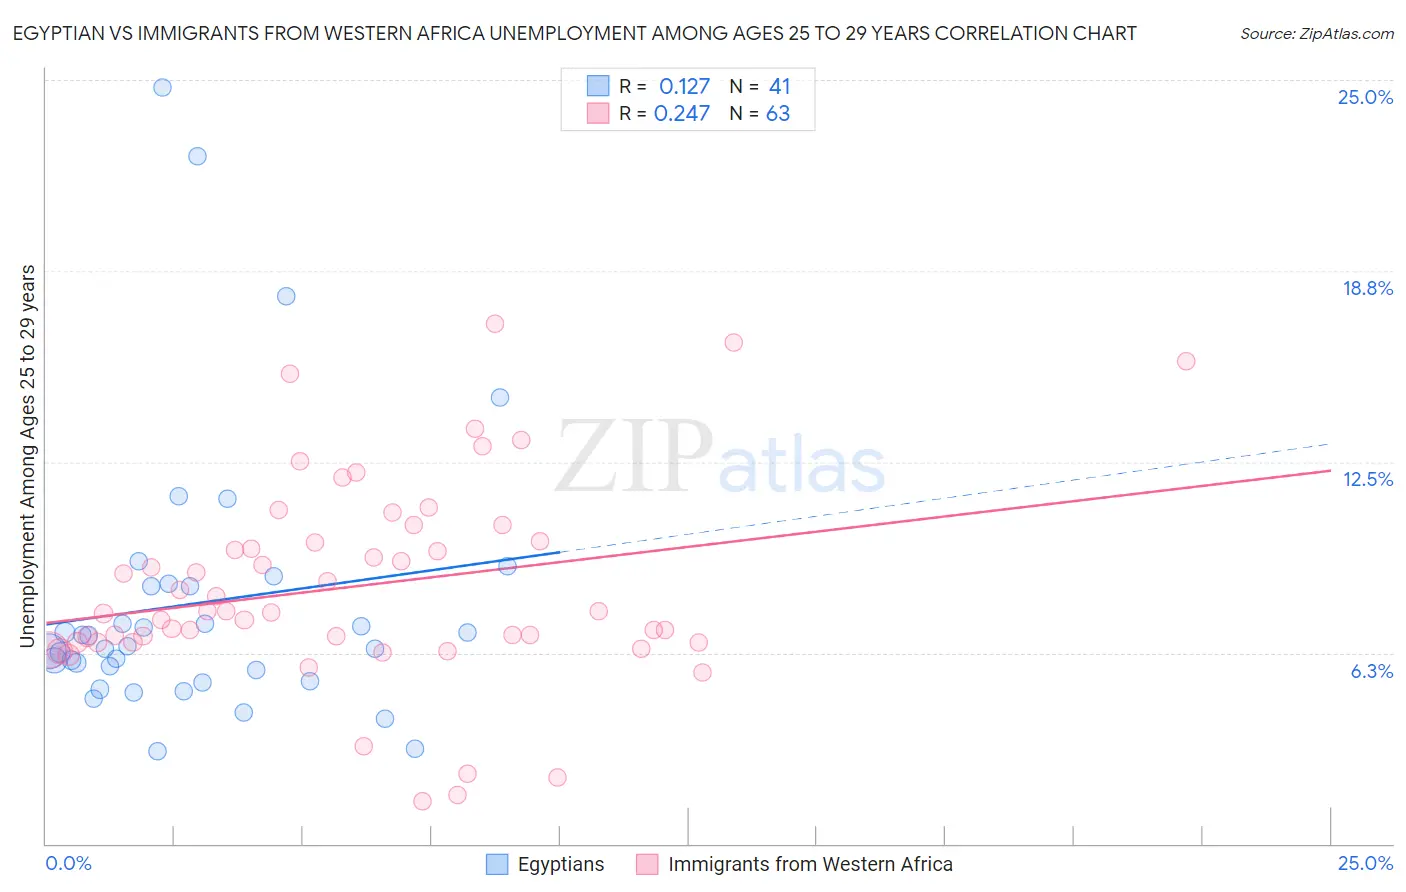
Egyptian vs Immigrants from Western Africa Unemployment Among Ages 25 to 29 years Correlation Chart
The statistical analysis conducted on geographies consisting of 269,654,922 people shows a poor positive correlation between the proportion of Egyptians and unemployment rate among population between the ages 25 and 29 in the United States with a correlation coefficient (R) of 0.127 and weighted average of 6.4%. Similarly, the statistical analysis conducted on geographies consisting of 345,655,040 people shows a weak positive correlation between the proportion of Immigrants from Western Africa and unemployment rate among population between the ages 25 and 29 in the United States with a correlation coefficient (R) of 0.247 and weighted average of 7.4%, a difference of 16.1%.
Unemployment Among Ages 25 to 29 years Correlation Summary
| Measurement | Egyptian | Immigrants from Western Africa |
| Minimum | 3.0% | 1.4% |
| Maximum | 24.8% | 17.0% |
| Range | 21.7% | 15.6% |
| Mean | 7.9% | 8.4% |
| Median | 6.5% | 7.6% |
| Interquartile 25% (IQ1) | 5.5% | 6.6% |
| Interquartile 75% (IQ3) | 8.5% | 9.9% |
| Interquartile Range (IQR) | 3.0% | 3.3% |
| Standard Deviation (Sample) | 4.6% | 3.3% |
| Standard Deviation (Population) | 4.5% | 3.3% |
Similar Demographics by Unemployment Among Ages 25 to 29 years
Demographics Similar to Egyptians by Unemployment Among Ages 25 to 29 years
In terms of unemployment among ages 25 to 29 years, the demographic groups most similar to Egyptians are Lebanese (6.4%, a difference of 0.010%), Immigrants from North Macedonia (6.4%, a difference of 0.060%), Australian (6.4%, a difference of 0.060%), Immigrants from Oceania (6.4%, a difference of 0.080%), and Zimbabwean (6.4%, a difference of 0.11%).
| Demographics | Rating | Rank | Unemployment Among Ages 25 to 29 years |
| Immigrants | Spain | 95.2 /100 | #84 | Exceptional 6.3% |
| Immigrants | Sweden | 95.1 /100 | #85 | Exceptional 6.3% |
| Immigrants | Asia | 94.9 /100 | #86 | Exceptional 6.3% |
| Marshallese | 94.7 /100 | #87 | Exceptional 6.4% |
| Immigrants | Indonesia | 94.5 /100 | #88 | Exceptional 6.4% |
| Immigrants | Oceania | 94.1 /100 | #89 | Exceptional 6.4% |
| Lebanese | 93.9 /100 | #90 | Exceptional 6.4% |
| Egyptians | 93.9 /100 | #91 | Exceptional 6.4% |
| Immigrants | North Macedonia | 93.6 /100 | #92 | Exceptional 6.4% |
| Australians | 93.6 /100 | #93 | Exceptional 6.4% |
| Zimbabweans | 93.5 /100 | #94 | Exceptional 6.4% |
| Afghans | 92.5 /100 | #95 | Exceptional 6.4% |
| Immigrants | Brazil | 92.1 /100 | #96 | Exceptional 6.4% |
| Immigrants | Eastern Europe | 91.9 /100 | #97 | Exceptional 6.4% |
| Serbians | 91.7 /100 | #98 | Exceptional 6.4% |
Demographics Similar to Immigrants from Western Africa by Unemployment Among Ages 25 to 29 years
In terms of unemployment among ages 25 to 29 years, the demographic groups most similar to Immigrants from Western Africa are Immigrants from Fiji (7.4%, a difference of 0.070%), Kiowa (7.4%, a difference of 0.090%), Ecuadorian (7.4%, a difference of 0.17%), Paiute (7.4%, a difference of 0.21%), and Nigerian (7.4%, a difference of 0.22%).
| Demographics | Rating | Rank | Unemployment Among Ages 25 to 29 years |
| Assyrians/Chaldeans/Syriacs | 0.2 /100 | #257 | Tragic 7.3% |
| Ottawa | 0.1 /100 | #258 | Tragic 7.3% |
| Cree | 0.1 /100 | #259 | Tragic 7.3% |
| Americans | 0.1 /100 | #260 | Tragic 7.4% |
| Nigerians | 0.1 /100 | #261 | Tragic 7.4% |
| Ecuadorians | 0.1 /100 | #262 | Tragic 7.4% |
| Kiowa | 0.1 /100 | #263 | Tragic 7.4% |
| Immigrants | Western Africa | 0.1 /100 | #264 | Tragic 7.4% |
| Immigrants | Fiji | 0.1 /100 | #265 | Tragic 7.4% |
| Paiute | 0.1 /100 | #266 | Tragic 7.4% |
| Pennsylvania Germans | 0.1 /100 | #267 | Tragic 7.4% |
| Immigrants | Ecuador | 0.1 /100 | #268 | Tragic 7.4% |
| Immigrants | Latin America | 0.1 /100 | #269 | Tragic 7.4% |
| Bahamians | 0.0 /100 | #270 | Tragic 7.5% |
| Choctaw | 0.0 /100 | #271 | Tragic 7.5% |