Egyptian vs Immigrants from Laos 4th Grade
COMPARE
Egyptian
Immigrants from Laos
4th Grade
4th Grade Comparison
Egyptians
Immigrants from Laos
97.5%
4TH GRADE
50.0/ 100
METRIC RATING
174th/ 347
METRIC RANK
96.3%
4TH GRADE
0.0/ 100
METRIC RATING
308th/ 347
METRIC RANK
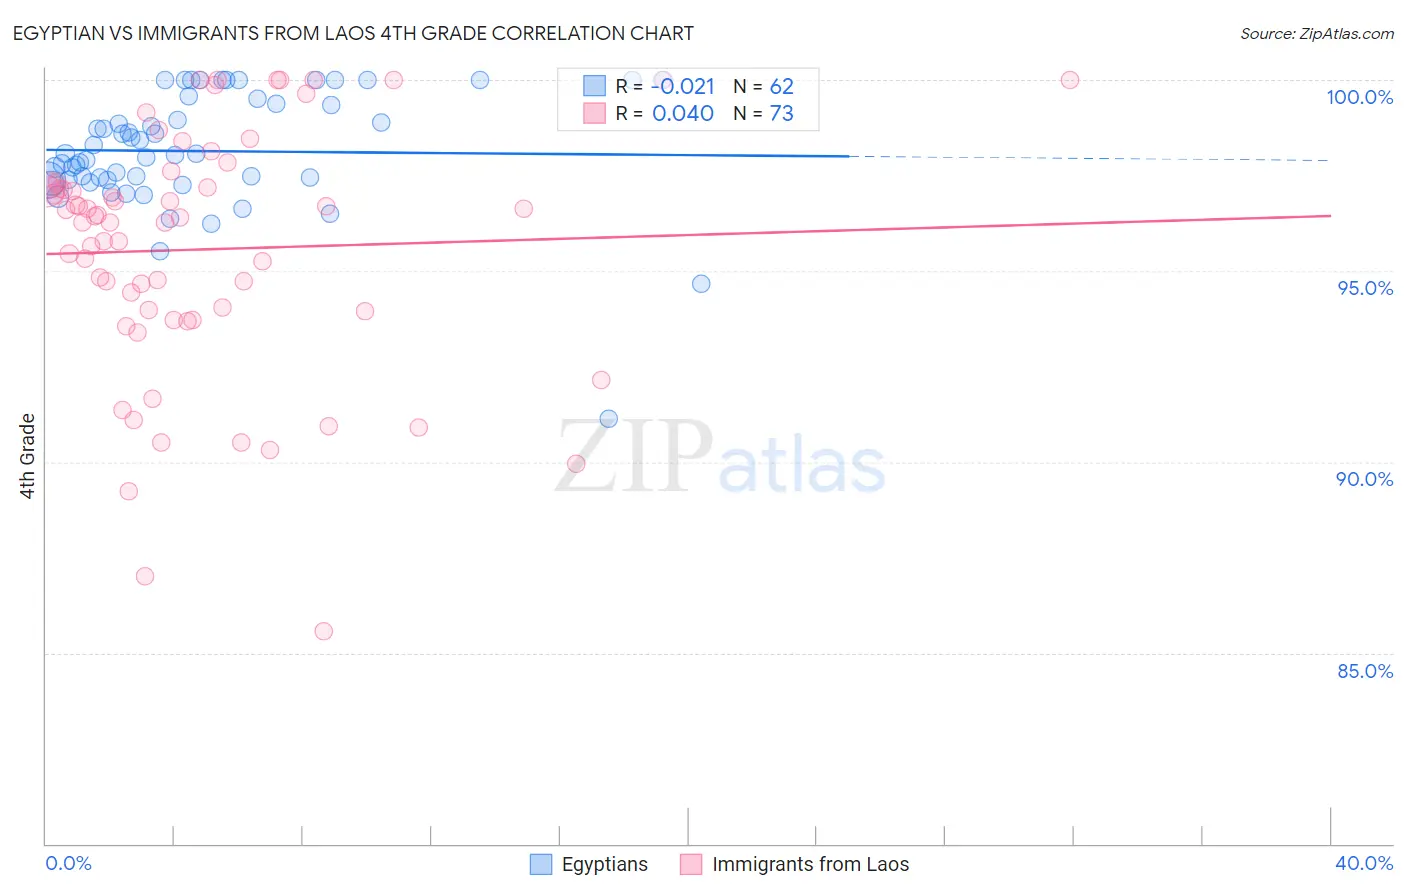
Egyptian vs Immigrants from Laos 4th Grade Correlation Chart
The statistical analysis conducted on geographies consisting of 276,927,423 people shows no correlation between the proportion of Egyptians and percentage of population with at least 4th grade education in the United States with a correlation coefficient (R) of -0.021 and weighted average of 97.5%. Similarly, the statistical analysis conducted on geographies consisting of 201,453,273 people shows no correlation between the proportion of Immigrants from Laos and percentage of population with at least 4th grade education in the United States with a correlation coefficient (R) of 0.040 and weighted average of 96.3%, a difference of 1.3%.
4th Grade Correlation Summary
| Measurement | Egyptian | Immigrants from Laos |
| Minimum | 91.1% | 85.6% |
| Maximum | 100.0% | 100.0% |
| Range | 8.9% | 14.4% |
| Mean | 98.1% | 95.6% |
| Median | 98.1% | 96.4% |
| Interquartile 25% (IQ1) | 97.4% | 93.8% |
| Interquartile 75% (IQ3) | 99.4% | 97.2% |
| Interquartile Range (IQR) | 2.0% | 3.4% |
| Standard Deviation (Sample) | 1.6% | 3.2% |
| Standard Deviation (Population) | 1.5% | 3.2% |
Similar Demographics by 4th Grade
Demographics Similar to Egyptians by 4th Grade
In terms of 4th grade, the demographic groups most similar to Egyptians are Immigrants from Sri Lanka (97.5%, a difference of 0.0%), Immigrants from Korea (97.5%, a difference of 0.0%), Immigrants from Micronesia (97.5%, a difference of 0.0%), Arab (97.5%, a difference of 0.0%), and Immigrants from Spain (97.5%, a difference of 0.010%).
| Demographics | Rating | Rank | 4th Grade |
| Immigrants | Poland | 55.9 /100 | #167 | Average 97.5% |
| Immigrants | Belarus | 55.8 /100 | #168 | Average 97.5% |
| Chileans | 54.4 /100 | #169 | Average 97.5% |
| Immigrants | Spain | 51.8 /100 | #170 | Average 97.5% |
| Brazilians | 51.5 /100 | #171 | Average 97.5% |
| Immigrants | Sri Lanka | 51.1 /100 | #172 | Average 97.5% |
| Immigrants | Korea | 50.6 /100 | #173 | Average 97.5% |
| Egyptians | 50.0 /100 | #174 | Average 97.5% |
| Immigrants | Micronesia | 49.6 /100 | #175 | Average 97.5% |
| Arabs | 48.7 /100 | #176 | Average 97.5% |
| Immigrants | Brazil | 46.1 /100 | #177 | Average 97.5% |
| Comanche | 45.3 /100 | #178 | Average 97.5% |
| Immigrants | Kazakhstan | 43.6 /100 | #179 | Average 97.5% |
| Immigrants | Venezuela | 42.7 /100 | #180 | Average 97.5% |
| Immigrants | Taiwan | 41.5 /100 | #181 | Average 97.5% |
Demographics Similar to Immigrants from Laos by 4th Grade
In terms of 4th grade, the demographic groups most similar to Immigrants from Laos are Immigrants from Guyana (96.3%, a difference of 0.0%), Immigrants from Haiti (96.3%, a difference of 0.010%), Sri Lankan (96.4%, a difference of 0.030%), Immigrants from Burma/Myanmar (96.3%, a difference of 0.030%), and Immigrants from Caribbean (96.4%, a difference of 0.050%).
| Demographics | Rating | Rank | 4th Grade |
| Immigrants | Immigrants | 0.0 /100 | #301 | Tragic 96.5% |
| Immigrants | Cuba | 0.0 /100 | #302 | Tragic 96.4% |
| Guyanese | 0.0 /100 | #303 | Tragic 96.4% |
| Ecuadorians | 0.0 /100 | #304 | Tragic 96.4% |
| Immigrants | Caribbean | 0.0 /100 | #305 | Tragic 96.4% |
| Sri Lankans | 0.0 /100 | #306 | Tragic 96.4% |
| Immigrants | Haiti | 0.0 /100 | #307 | Tragic 96.3% |
| Immigrants | Laos | 0.0 /100 | #308 | Tragic 96.3% |
| Immigrants | Guyana | 0.0 /100 | #309 | Tragic 96.3% |
| Immigrants | Burma/Myanmar | 0.0 /100 | #310 | Tragic 96.3% |
| Immigrants | Bangladesh | 0.0 /100 | #311 | Tragic 96.2% |
| Cape Verdeans | 0.0 /100 | #312 | Tragic 96.2% |
| Indonesians | 0.0 /100 | #313 | Tragic 96.2% |
| Vietnamese | 0.0 /100 | #314 | Tragic 96.2% |
| Nicaraguans | 0.0 /100 | #315 | Tragic 96.2% |