Egyptian vs South American 4th Grade
COMPARE
Egyptian
South American
4th Grade
4th Grade Comparison
Egyptians
South Americans
97.5%
4TH GRADE
50.0/ 100
METRIC RATING
174th/ 347
METRIC RANK
97.1%
4TH GRADE
0.8/ 100
METRIC RATING
251st/ 347
METRIC RANK
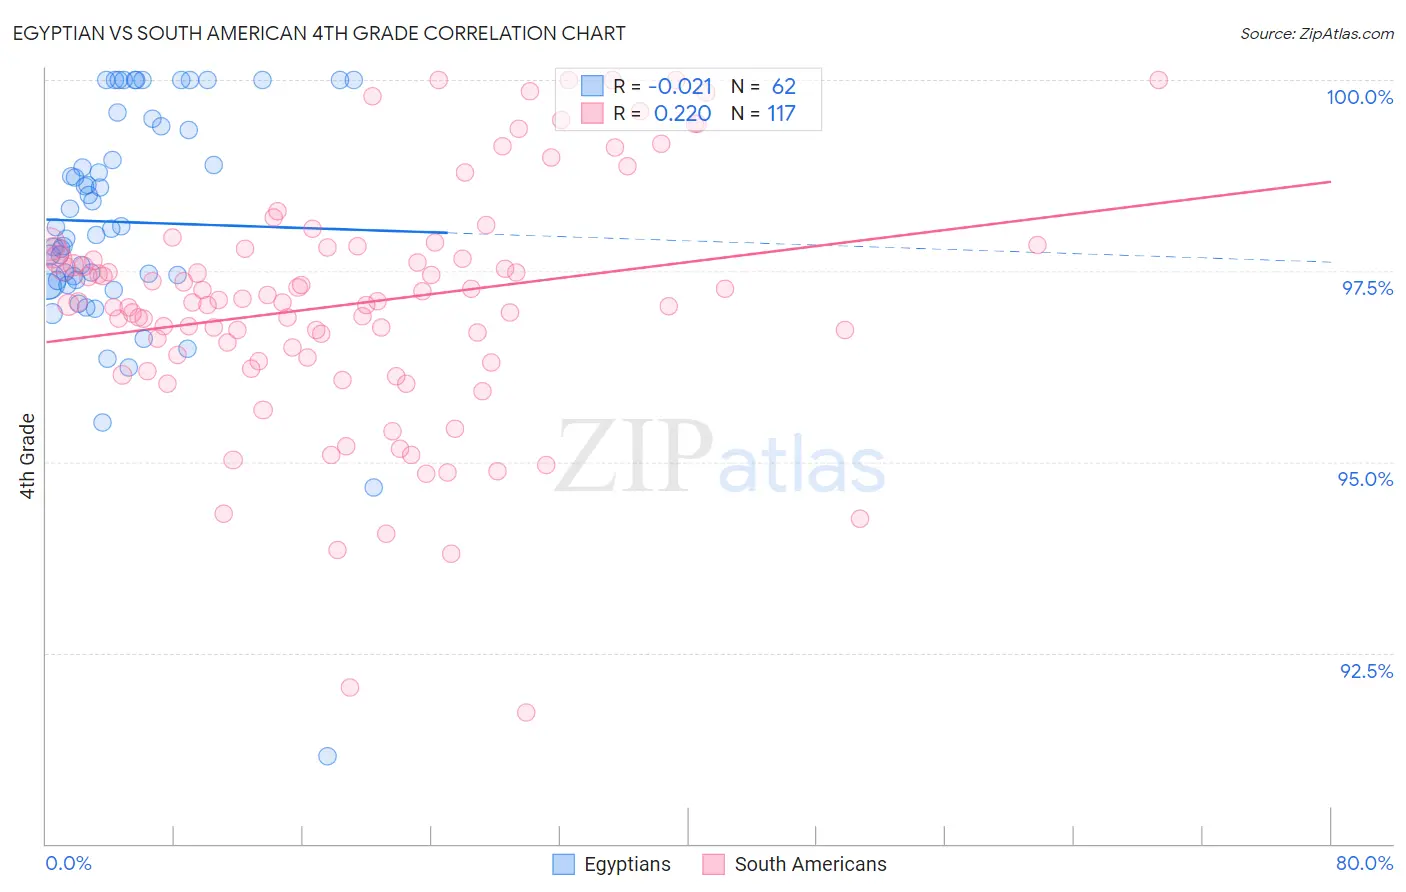
Egyptian vs South American 4th Grade Correlation Chart
The statistical analysis conducted on geographies consisting of 276,927,423 people shows no correlation between the proportion of Egyptians and percentage of population with at least 4th grade education in the United States with a correlation coefficient (R) of -0.021 and weighted average of 97.5%. Similarly, the statistical analysis conducted on geographies consisting of 494,178,447 people shows a weak positive correlation between the proportion of South Americans and percentage of population with at least 4th grade education in the United States with a correlation coefficient (R) of 0.220 and weighted average of 97.1%, a difference of 0.45%.
4th Grade Correlation Summary
| Measurement | Egyptian | South American |
| Minimum | 91.1% | 91.7% |
| Maximum | 100.0% | 100.0% |
| Range | 8.9% | 8.3% |
| Mean | 98.1% | 97.1% |
| Median | 98.1% | 97.1% |
| Interquartile 25% (IQ1) | 97.4% | 96.3% |
| Interquartile 75% (IQ3) | 99.4% | 97.8% |
| Interquartile Range (IQR) | 2.0% | 1.5% |
| Standard Deviation (Sample) | 1.6% | 1.6% |
| Standard Deviation (Population) | 1.5% | 1.6% |
Similar Demographics by 4th Grade
Demographics Similar to Egyptians by 4th Grade
In terms of 4th grade, the demographic groups most similar to Egyptians are Immigrants from Sri Lanka (97.5%, a difference of 0.0%), Immigrants from Korea (97.5%, a difference of 0.0%), Immigrants from Micronesia (97.5%, a difference of 0.0%), Arab (97.5%, a difference of 0.0%), and Immigrants from Spain (97.5%, a difference of 0.010%).
| Demographics | Rating | Rank | 4th Grade |
| Immigrants | Poland | 55.9 /100 | #167 | Average 97.5% |
| Immigrants | Belarus | 55.8 /100 | #168 | Average 97.5% |
| Chileans | 54.4 /100 | #169 | Average 97.5% |
| Immigrants | Spain | 51.8 /100 | #170 | Average 97.5% |
| Brazilians | 51.5 /100 | #171 | Average 97.5% |
| Immigrants | Sri Lanka | 51.1 /100 | #172 | Average 97.5% |
| Immigrants | Korea | 50.6 /100 | #173 | Average 97.5% |
| Egyptians | 50.0 /100 | #174 | Average 97.5% |
| Immigrants | Micronesia | 49.6 /100 | #175 | Average 97.5% |
| Arabs | 48.7 /100 | #176 | Average 97.5% |
| Immigrants | Brazil | 46.1 /100 | #177 | Average 97.5% |
| Comanche | 45.3 /100 | #178 | Average 97.5% |
| Immigrants | Kazakhstan | 43.6 /100 | #179 | Average 97.5% |
| Immigrants | Venezuela | 42.7 /100 | #180 | Average 97.5% |
| Immigrants | Taiwan | 41.5 /100 | #181 | Average 97.5% |
Demographics Similar to South Americans by 4th Grade
In terms of 4th grade, the demographic groups most similar to South Americans are Jamaican (97.1%, a difference of 0.0%), Immigrants from Liberia (97.1%, a difference of 0.0%), Immigrants from Middle Africa (97.1%, a difference of 0.0%), Immigrants from Africa (97.1%, a difference of 0.010%), and Immigrants from Senegal (97.1%, a difference of 0.010%).
| Demographics | Rating | Rank | 4th Grade |
| Koreans | 1.3 /100 | #244 | Tragic 97.1% |
| Immigrants | Eastern Africa | 1.2 /100 | #245 | Tragic 97.1% |
| Immigrants | Uruguay | 1.2 /100 | #246 | Tragic 97.1% |
| Ethiopians | 1.2 /100 | #247 | Tragic 97.1% |
| Immigrants | Asia | 1.2 /100 | #248 | Tragic 97.1% |
| Immigrants | Africa | 1.0 /100 | #249 | Tragic 97.1% |
| Immigrants | Senegal | 0.9 /100 | #250 | Tragic 97.1% |
| South Americans | 0.8 /100 | #251 | Tragic 97.1% |
| Jamaicans | 0.8 /100 | #252 | Tragic 97.1% |
| Immigrants | Liberia | 0.8 /100 | #253 | Tragic 97.1% |
| Immigrants | Middle Africa | 0.8 /100 | #254 | Tragic 97.1% |
| Peruvians | 0.7 /100 | #255 | Tragic 97.1% |
| Bolivians | 0.7 /100 | #256 | Tragic 97.1% |
| Immigrants | Congo | 0.5 /100 | #257 | Tragic 97.0% |
| Immigrants | Colombia | 0.5 /100 | #258 | Tragic 97.0% |