Belgian vs Comanche 9th Grade
COMPARE
Belgian
Comanche
9th Grade
9th Grade Comparison
Belgians
Comanche
96.3%
9TH GRADE
100.0/ 100
METRIC RATING
32nd/ 347
METRIC RANK
94.6%
9TH GRADE
14.9/ 100
METRIC RATING
209th/ 347
METRIC RANK
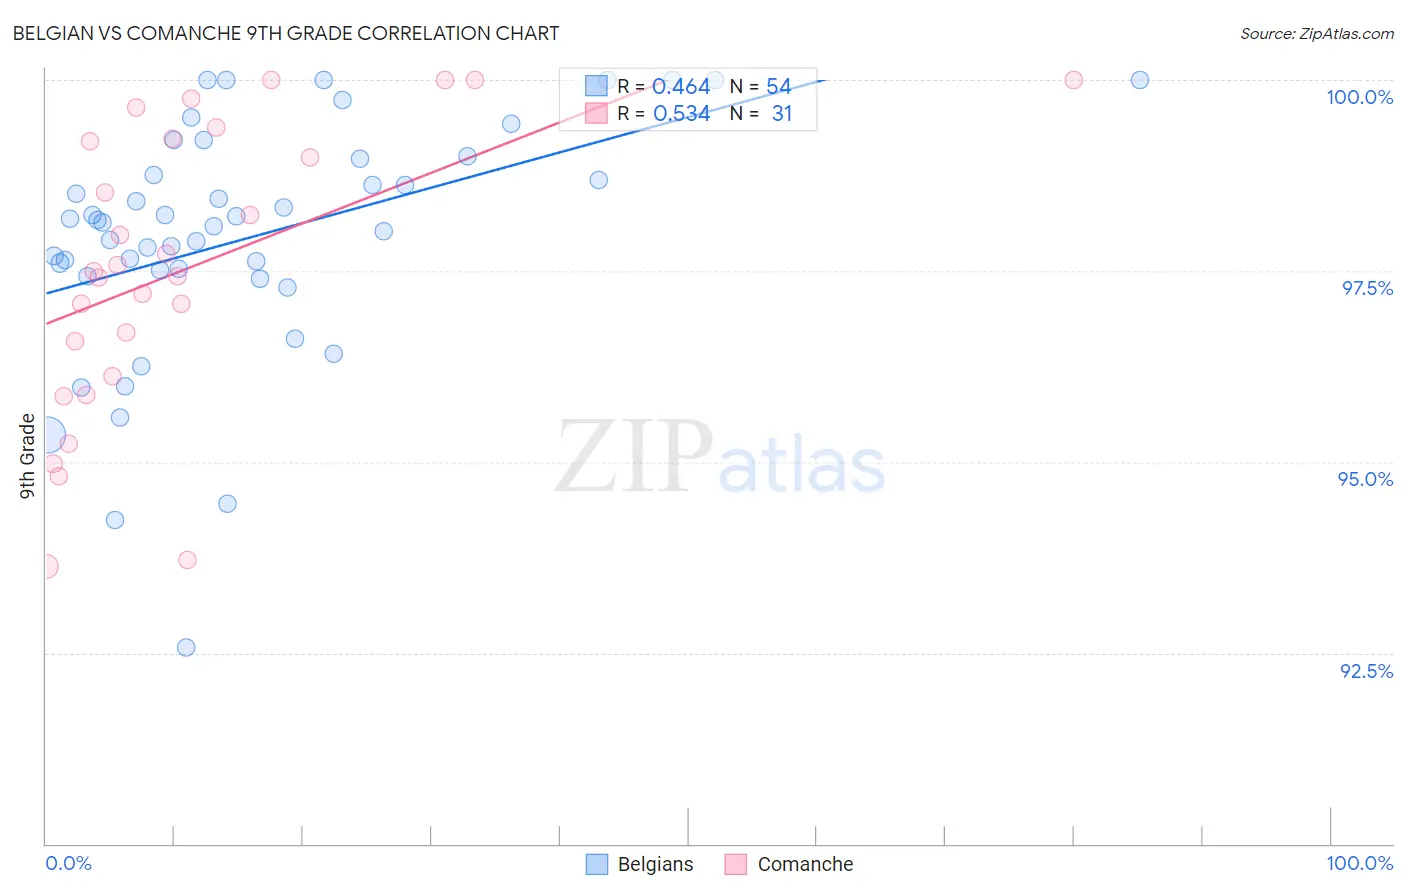
Belgian vs Comanche 9th Grade Correlation Chart
The statistical analysis conducted on geographies consisting of 356,019,407 people shows a moderate positive correlation between the proportion of Belgians and percentage of population with at least 9th grade education in the United States with a correlation coefficient (R) of 0.464 and weighted average of 96.3%. Similarly, the statistical analysis conducted on geographies consisting of 109,786,530 people shows a substantial positive correlation between the proportion of Comanche and percentage of population with at least 9th grade education in the United States with a correlation coefficient (R) of 0.534 and weighted average of 94.6%, a difference of 1.8%.
9th Grade Correlation Summary
| Measurement | Belgian | Comanche |
| Minimum | 92.6% | 93.6% |
| Maximum | 100.0% | 100.0% |
| Range | 7.4% | 6.4% |
| Mean | 97.9% | 97.5% |
| Median | 98.2% | 97.5% |
| Interquartile 25% (IQ1) | 97.5% | 96.1% |
| Interquartile 75% (IQ3) | 99.0% | 99.2% |
| Interquartile Range (IQR) | 1.5% | 3.1% |
| Standard Deviation (Sample) | 1.6% | 1.9% |
| Standard Deviation (Population) | 1.6% | 1.8% |
Similar Demographics by 9th Grade
Demographics Similar to Belgians by 9th Grade
In terms of 9th grade, the demographic groups most similar to Belgians are British (96.3%, a difference of 0.0%), Maltese (96.3%, a difference of 0.010%), Luxembourger (96.3%, a difference of 0.010%), Chinese (96.3%, a difference of 0.030%), and Scotch-Irish (96.3%, a difference of 0.040%).
| Demographics | Rating | Rank | 9th Grade |
| French | 100.0 /100 | #25 | Exceptional 96.3% |
| French Canadians | 100.0 /100 | #26 | Exceptional 96.3% |
| Scotch-Irish | 100.0 /100 | #27 | Exceptional 96.3% |
| Eastern Europeans | 100.0 /100 | #28 | Exceptional 96.3% |
| Chinese | 100.0 /100 | #29 | Exceptional 96.3% |
| Maltese | 100.0 /100 | #30 | Exceptional 96.3% |
| British | 100.0 /100 | #31 | Exceptional 96.3% |
| Belgians | 100.0 /100 | #32 | Exceptional 96.3% |
| Luxembourgers | 100.0 /100 | #33 | Exceptional 96.3% |
| Hungarians | 100.0 /100 | #34 | Exceptional 96.2% |
| Bulgarians | 99.9 /100 | #35 | Exceptional 96.2% |
| Northern Europeans | 99.9 /100 | #36 | Exceptional 96.2% |
| Estonians | 99.9 /100 | #37 | Exceptional 96.1% |
| Immigrants | Scotland | 99.9 /100 | #38 | Exceptional 96.1% |
| Ottawa | 99.9 /100 | #39 | Exceptional 96.1% |
Demographics Similar to Comanche by 9th Grade
In terms of 9th grade, the demographic groups most similar to Comanche are Immigrants from Pakistan (94.6%, a difference of 0.010%), Immigrants from Morocco (94.6%, a difference of 0.020%), Immigrants from Chile (94.5%, a difference of 0.020%), Samoan (94.6%, a difference of 0.030%), and Immigrants from Sudan (94.6%, a difference of 0.040%).
| Demographics | Rating | Rank | 9th Grade |
| Immigrants | Eastern Asia | 19.8 /100 | #202 | Poor 94.6% |
| Immigrants | Bahamas | 19.8 /100 | #203 | Poor 94.6% |
| Moroccans | 19.6 /100 | #204 | Poor 94.6% |
| Immigrants | Sudan | 17.6 /100 | #205 | Poor 94.6% |
| Samoans | 17.3 /100 | #206 | Poor 94.6% |
| Immigrants | Morocco | 16.3 /100 | #207 | Poor 94.6% |
| Immigrants | Pakistan | 15.5 /100 | #208 | Poor 94.6% |
| Comanche | 14.9 /100 | #209 | Poor 94.6% |
| Immigrants | Chile | 13.4 /100 | #210 | Poor 94.5% |
| Immigrants | Indonesia | 12.3 /100 | #211 | Poor 94.5% |
| Immigrants | Malaysia | 12.2 /100 | #212 | Poor 94.5% |
| Immigrants | Oceania | 12.1 /100 | #213 | Poor 94.5% |
| Immigrants | Liberia | 11.8 /100 | #214 | Poor 94.5% |
| Immigrants | Syria | 11.0 /100 | #215 | Poor 94.5% |
| Immigrants | Western Asia | 10.7 /100 | #216 | Poor 94.5% |