Ecuadorian vs Immigrants from Korea 4th Grade
COMPARE
Ecuadorian
Immigrants from Korea
4th Grade
4th Grade Comparison
Ecuadorians
Immigrants from Korea
96.4%
4TH GRADE
0.0/ 100
METRIC RATING
304th/ 347
METRIC RANK
97.5%
4TH GRADE
50.6/ 100
METRIC RATING
173rd/ 347
METRIC RANK
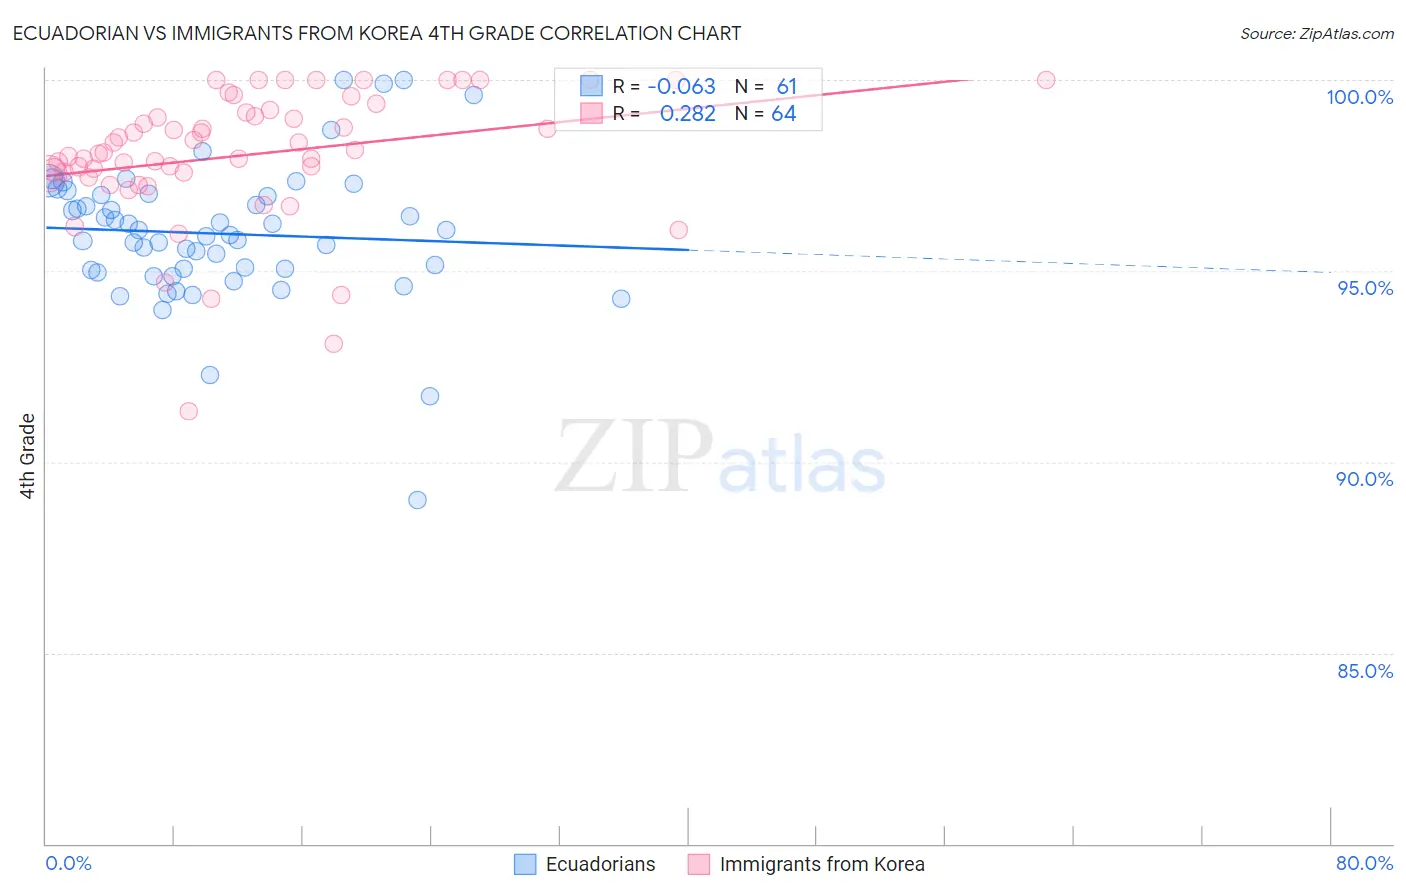
Ecuadorian vs Immigrants from Korea 4th Grade Correlation Chart
The statistical analysis conducted on geographies consisting of 317,865,723 people shows a slight negative correlation between the proportion of Ecuadorians and percentage of population with at least 4th grade education in the United States with a correlation coefficient (R) of -0.063 and weighted average of 96.4%. Similarly, the statistical analysis conducted on geographies consisting of 416,280,076 people shows a weak positive correlation between the proportion of Immigrants from Korea and percentage of population with at least 4th grade education in the United States with a correlation coefficient (R) of 0.282 and weighted average of 97.5%, a difference of 1.2%.
4th Grade Correlation Summary
| Measurement | Ecuadorian | Immigrants from Korea |
| Minimum | 89.0% | 91.3% |
| Maximum | 100.0% | 100.0% |
| Range | 11.0% | 8.7% |
| Mean | 96.0% | 98.0% |
| Median | 96.0% | 98.1% |
| Interquartile 25% (IQ1) | 95.0% | 97.6% |
| Interquartile 75% (IQ3) | 97.0% | 99.2% |
| Interquartile Range (IQR) | 2.0% | 1.6% |
| Standard Deviation (Sample) | 1.8% | 1.7% |
| Standard Deviation (Population) | 1.8% | 1.7% |
Similar Demographics by 4th Grade
Demographics Similar to Ecuadorians by 4th Grade
In terms of 4th grade, the demographic groups most similar to Ecuadorians are Guyanese (96.4%, a difference of 0.010%), Immigrants from Caribbean (96.4%, a difference of 0.020%), Sri Lankan (96.4%, a difference of 0.030%), Immigrants from Cuba (96.4%, a difference of 0.060%), and Immigrants from Haiti (96.3%, a difference of 0.060%).
| Demographics | Rating | Rank | 4th Grade |
| Immigrants | Somalia | 0.0 /100 | #297 | Tragic 96.5% |
| Haitians | 0.0 /100 | #298 | Tragic 96.5% |
| Immigrants | Dominica | 0.0 /100 | #299 | Tragic 96.5% |
| Immigrants | South Eastern Asia | 0.0 /100 | #300 | Tragic 96.5% |
| Immigrants | Immigrants | 0.0 /100 | #301 | Tragic 96.5% |
| Immigrants | Cuba | 0.0 /100 | #302 | Tragic 96.4% |
| Guyanese | 0.0 /100 | #303 | Tragic 96.4% |
| Ecuadorians | 0.0 /100 | #304 | Tragic 96.4% |
| Immigrants | Caribbean | 0.0 /100 | #305 | Tragic 96.4% |
| Sri Lankans | 0.0 /100 | #306 | Tragic 96.4% |
| Immigrants | Haiti | 0.0 /100 | #307 | Tragic 96.3% |
| Immigrants | Laos | 0.0 /100 | #308 | Tragic 96.3% |
| Immigrants | Guyana | 0.0 /100 | #309 | Tragic 96.3% |
| Immigrants | Burma/Myanmar | 0.0 /100 | #310 | Tragic 96.3% |
| Immigrants | Bangladesh | 0.0 /100 | #311 | Tragic 96.2% |
Demographics Similar to Immigrants from Korea by 4th Grade
In terms of 4th grade, the demographic groups most similar to Immigrants from Korea are Immigrants from Spain (97.5%, a difference of 0.0%), Brazilian (97.5%, a difference of 0.0%), Immigrants from Sri Lanka (97.5%, a difference of 0.0%), Egyptian (97.5%, a difference of 0.0%), and Immigrants from Micronesia (97.5%, a difference of 0.0%).
| Demographics | Rating | Rank | 4th Grade |
| Kenyans | 56.5 /100 | #166 | Average 97.5% |
| Immigrants | Poland | 55.9 /100 | #167 | Average 97.5% |
| Immigrants | Belarus | 55.8 /100 | #168 | Average 97.5% |
| Chileans | 54.4 /100 | #169 | Average 97.5% |
| Immigrants | Spain | 51.8 /100 | #170 | Average 97.5% |
| Brazilians | 51.5 /100 | #171 | Average 97.5% |
| Immigrants | Sri Lanka | 51.1 /100 | #172 | Average 97.5% |
| Immigrants | Korea | 50.6 /100 | #173 | Average 97.5% |
| Egyptians | 50.0 /100 | #174 | Average 97.5% |
| Immigrants | Micronesia | 49.6 /100 | #175 | Average 97.5% |
| Arabs | 48.7 /100 | #176 | Average 97.5% |
| Immigrants | Brazil | 46.1 /100 | #177 | Average 97.5% |
| Comanche | 45.3 /100 | #178 | Average 97.5% |
| Immigrants | Kazakhstan | 43.6 /100 | #179 | Average 97.5% |
| Immigrants | Venezuela | 42.7 /100 | #180 | Average 97.5% |