Irish vs Immigrants from Lebanon 7th Grade
COMPARE
Irish
Immigrants from Lebanon
7th Grade
7th Grade Comparison
Irish
Immigrants from Lebanon
97.5%
7TH GRADE
100.0/ 100
METRIC RATING
16th/ 347
METRIC RANK
95.8%
7TH GRADE
13.0/ 100
METRIC RATING
212th/ 347
METRIC RANK
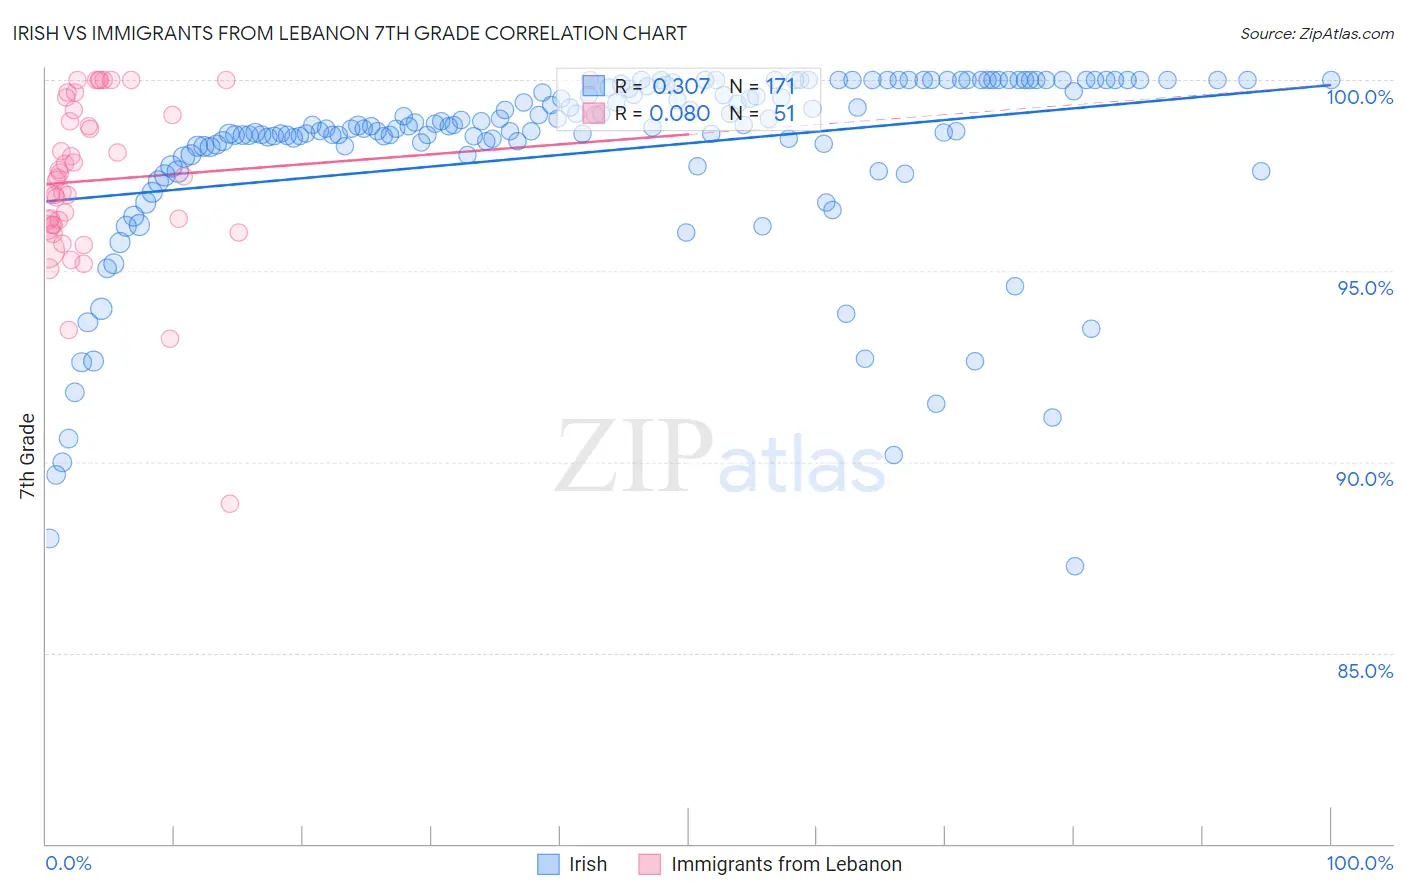
Irish vs Immigrants from Lebanon 7th Grade Correlation Chart
The statistical analysis conducted on geographies consisting of 580,710,695 people shows a mild positive correlation between the proportion of Irish and percentage of population with at least 7th grade education in the United States with a correlation coefficient (R) of 0.307 and weighted average of 97.5%. Similarly, the statistical analysis conducted on geographies consisting of 217,083,357 people shows a slight positive correlation between the proportion of Immigrants from Lebanon and percentage of population with at least 7th grade education in the United States with a correlation coefficient (R) of 0.080 and weighted average of 95.8%, a difference of 1.8%.
7th Grade Correlation Summary
| Measurement | Irish | Immigrants from Lebanon |
| Minimum | 87.3% | 88.9% |
| Maximum | 100.0% | 100.0% |
| Range | 12.7% | 11.1% |
| Mean | 98.1% | 97.4% |
| Median | 98.8% | 97.4% |
| Interquartile 25% (IQ1) | 98.3% | 96.2% |
| Interquartile 75% (IQ3) | 99.9% | 99.2% |
| Interquartile Range (IQR) | 1.6% | 3.0% |
| Standard Deviation (Sample) | 2.5% | 2.2% |
| Standard Deviation (Population) | 2.5% | 2.1% |
Similar Demographics by 7th Grade
Demographics Similar to Irish by 7th Grade
In terms of 7th grade, the demographic groups most similar to Irish are Scottish (97.5%, a difference of 0.010%), Tlingit-Haida (97.5%, a difference of 0.020%), Lithuanian (97.5%, a difference of 0.030%), English (97.6%, a difference of 0.060%), and Pennsylvania German (97.6%, a difference of 0.070%).
| Demographics | Rating | Rank | 7th Grade |
| Germans | 100.0 /100 | #9 | Exceptional 97.7% |
| Slovenes | 100.0 /100 | #10 | Exceptional 97.6% |
| Alaskan Athabascans | 100.0 /100 | #11 | Exceptional 97.6% |
| Poles | 100.0 /100 | #12 | Exceptional 97.6% |
| Swedes | 100.0 /100 | #13 | Exceptional 97.6% |
| Pennsylvania Germans | 100.0 /100 | #14 | Exceptional 97.6% |
| English | 100.0 /100 | #15 | Exceptional 97.6% |
| Irish | 100.0 /100 | #16 | Exceptional 97.5% |
| Scottish | 100.0 /100 | #17 | Exceptional 97.5% |
| Tlingit-Haida | 100.0 /100 | #18 | Exceptional 97.5% |
| Lithuanians | 100.0 /100 | #19 | Exceptional 97.5% |
| Yup'ik | 100.0 /100 | #20 | Exceptional 97.4% |
| Inupiat | 100.0 /100 | #21 | Exceptional 97.4% |
| French Canadians | 100.0 /100 | #22 | Exceptional 97.4% |
| Croatians | 100.0 /100 | #23 | Exceptional 97.4% |
Demographics Similar to Immigrants from Lebanon by 7th Grade
In terms of 7th grade, the demographic groups most similar to Immigrants from Lebanon are Immigrants from Morocco (95.8%, a difference of 0.0%), Portuguese (95.8%, a difference of 0.010%), Bahamian (95.7%, a difference of 0.020%), Dutch West Indian (95.8%, a difference of 0.040%), and Hawaiian (95.8%, a difference of 0.040%).
| Demographics | Rating | Rank | 7th Grade |
| Moroccans | 18.9 /100 | #205 | Poor 95.8% |
| Africans | 17.6 /100 | #206 | Poor 95.8% |
| Navajo | 17.0 /100 | #207 | Poor 95.8% |
| Immigrants | Sudan | 17.0 /100 | #208 | Poor 95.8% |
| Dutch West Indians | 16.1 /100 | #209 | Poor 95.8% |
| Hawaiians | 16.0 /100 | #210 | Poor 95.8% |
| Portuguese | 13.6 /100 | #211 | Poor 95.8% |
| Immigrants | Lebanon | 13.0 /100 | #212 | Poor 95.8% |
| Immigrants | Morocco | 12.6 /100 | #213 | Poor 95.8% |
| Bahamians | 11.6 /100 | #214 | Poor 95.7% |
| Spanish Americans | 9.3 /100 | #215 | Tragic 95.7% |
| Immigrants | Chile | 9.1 /100 | #216 | Tragic 95.7% |
| Immigrants | Pakistan | 9.0 /100 | #217 | Tragic 95.7% |
| Immigrants | Liberia | 8.1 /100 | #218 | Tragic 95.7% |
| Immigrants | Southern Europe | 7.9 /100 | #219 | Tragic 95.7% |