Chickasaw vs Immigrants from Guyana 7th Grade
COMPARE
Chickasaw
Immigrants from Guyana
7th Grade
7th Grade Comparison
Chickasaw
Immigrants from Guyana
96.7%
7TH GRADE
99.2/ 100
METRIC RATING
82nd/ 347
METRIC RANK
94.2%
7TH GRADE
0.0/ 100
METRIC RATING
306th/ 347
METRIC RANK
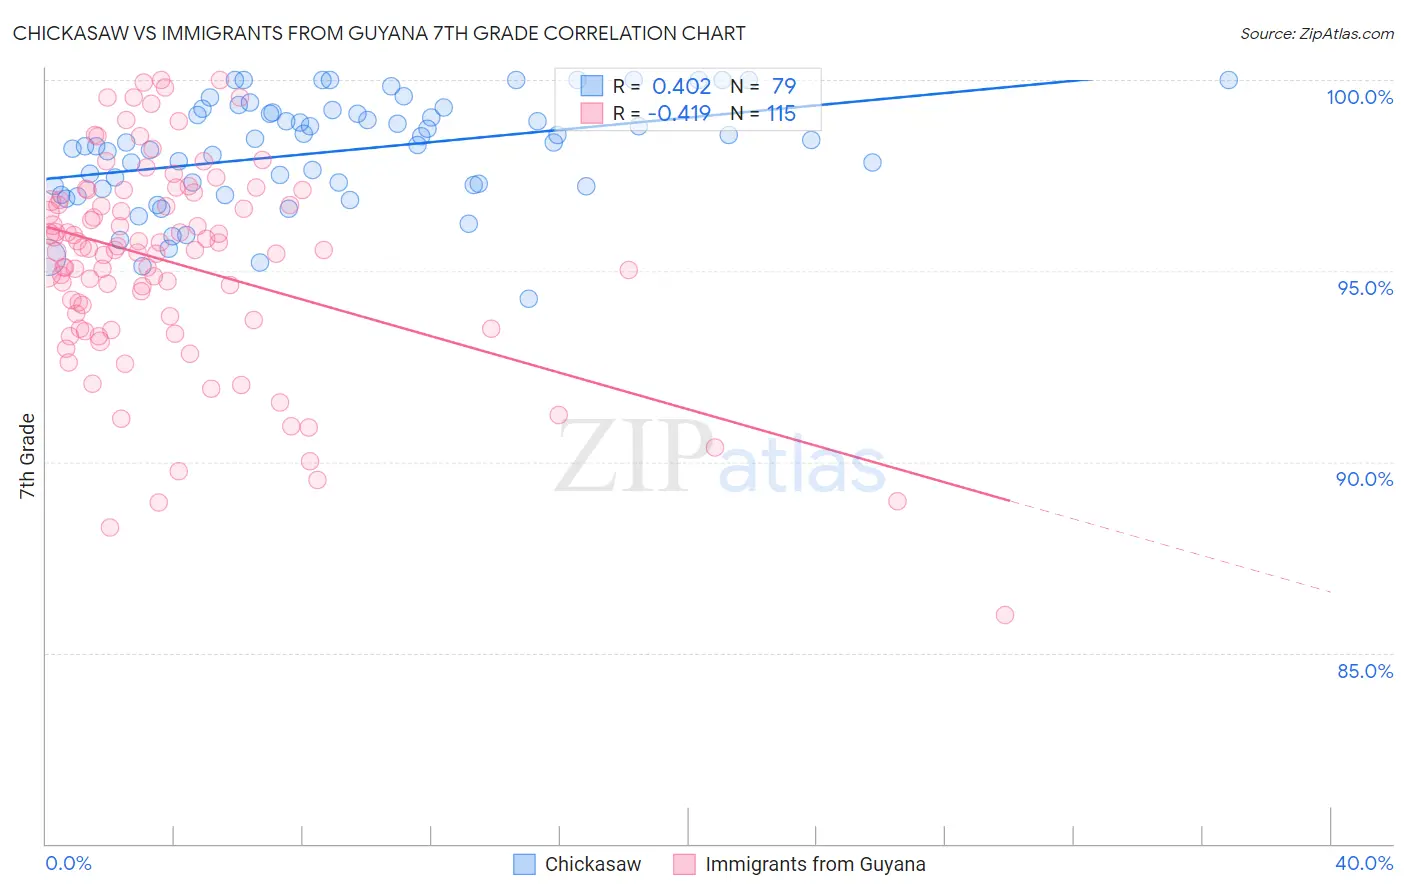
Chickasaw vs Immigrants from Guyana 7th Grade Correlation Chart
The statistical analysis conducted on geographies consisting of 147,726,545 people shows a moderate positive correlation between the proportion of Chickasaw and percentage of population with at least 7th grade education in the United States with a correlation coefficient (R) of 0.402 and weighted average of 96.7%. Similarly, the statistical analysis conducted on geographies consisting of 183,673,461 people shows a moderate negative correlation between the proportion of Immigrants from Guyana and percentage of population with at least 7th grade education in the United States with a correlation coefficient (R) of -0.419 and weighted average of 94.2%, a difference of 2.7%.
7th Grade Correlation Summary
| Measurement | Chickasaw | Immigrants from Guyana |
| Minimum | 94.3% | 86.0% |
| Maximum | 100.0% | 100.0% |
| Range | 5.7% | 14.0% |
| Mean | 98.1% | 95.2% |
| Median | 98.4% | 95.5% |
| Interquartile 25% (IQ1) | 97.2% | 93.7% |
| Interquartile 75% (IQ3) | 99.1% | 96.9% |
| Interquartile Range (IQR) | 1.9% | 3.1% |
| Standard Deviation (Sample) | 1.4% | 2.7% |
| Standard Deviation (Population) | 1.4% | 2.7% |
Similar Demographics by 7th Grade
Demographics Similar to Chickasaw by 7th Grade
In terms of 7th grade, the demographic groups most similar to Chickasaw are Delaware (96.8%, a difference of 0.010%), Icelander (96.7%, a difference of 0.010%), Romanian (96.7%, a difference of 0.010%), Kiowa (96.7%, a difference of 0.010%), and Turkish (96.7%, a difference of 0.020%).
| Demographics | Rating | Rank | 7th Grade |
| Zimbabweans | 99.5 /100 | #75 | Exceptional 96.8% |
| Immigrants | Ireland | 99.4 /100 | #76 | Exceptional 96.8% |
| Cherokee | 99.4 /100 | #77 | Exceptional 96.8% |
| Immigrants | Netherlands | 99.3 /100 | #78 | Exceptional 96.8% |
| Cypriots | 99.3 /100 | #79 | Exceptional 96.8% |
| Yugoslavians | 99.3 /100 | #80 | Exceptional 96.8% |
| Delaware | 99.2 /100 | #81 | Exceptional 96.8% |
| Chickasaw | 99.2 /100 | #82 | Exceptional 96.7% |
| Icelanders | 99.1 /100 | #83 | Exceptional 96.7% |
| Romanians | 99.1 /100 | #84 | Exceptional 96.7% |
| Kiowa | 99.1 /100 | #85 | Exceptional 96.7% |
| Turks | 99.1 /100 | #86 | Exceptional 96.7% |
| Immigrants | Belgium | 99.0 /100 | #87 | Exceptional 96.7% |
| Puget Sound Salish | 99.0 /100 | #88 | Exceptional 96.7% |
| Cree | 99.0 /100 | #89 | Exceptional 96.7% |
Demographics Similar to Immigrants from Guyana by 7th Grade
In terms of 7th grade, the demographic groups most similar to Immigrants from Guyana are Immigrants from Portugal (94.2%, a difference of 0.020%), Cape Verdean (94.1%, a difference of 0.10%), Guyanese (94.3%, a difference of 0.13%), Immigrants from Haiti (94.3%, a difference of 0.15%), and Ecuadorian (94.0%, a difference of 0.16%).
| Demographics | Rating | Rank | 7th Grade |
| Bangladeshis | 0.0 /100 | #299 | Tragic 94.5% |
| Immigrants | Burma/Myanmar | 0.0 /100 | #300 | Tragic 94.5% |
| Immigrants | Dominica | 0.0 /100 | #301 | Tragic 94.5% |
| Immigrants | Laos | 0.0 /100 | #302 | Tragic 94.5% |
| Sri Lankans | 0.0 /100 | #303 | Tragic 94.4% |
| Immigrants | Haiti | 0.0 /100 | #304 | Tragic 94.3% |
| Guyanese | 0.0 /100 | #305 | Tragic 94.3% |
| Immigrants | Guyana | 0.0 /100 | #306 | Tragic 94.2% |
| Immigrants | Portugal | 0.0 /100 | #307 | Tragic 94.2% |
| Cape Verdeans | 0.0 /100 | #308 | Tragic 94.1% |
| Ecuadorians | 0.0 /100 | #309 | Tragic 94.0% |
| Immigrants | Caribbean | 0.0 /100 | #310 | Tragic 94.0% |
| Puerto Ricans | 0.0 /100 | #311 | Tragic 94.0% |
| Immigrants | Immigrants | 0.0 /100 | #312 | Tragic 94.0% |
| Immigrants | Bangladesh | 0.0 /100 | #313 | Tragic 94.0% |