Kenyan vs Immigrants from China 4th Grade
COMPARE
Kenyan
Immigrants from China
4th Grade
4th Grade Comparison
Kenyans
Immigrants from China
97.5%
4TH GRADE
56.5/ 100
METRIC RATING
166th/ 347
METRIC RANK
97.0%
4TH GRADE
0.3/ 100
METRIC RATING
266th/ 347
METRIC RANK
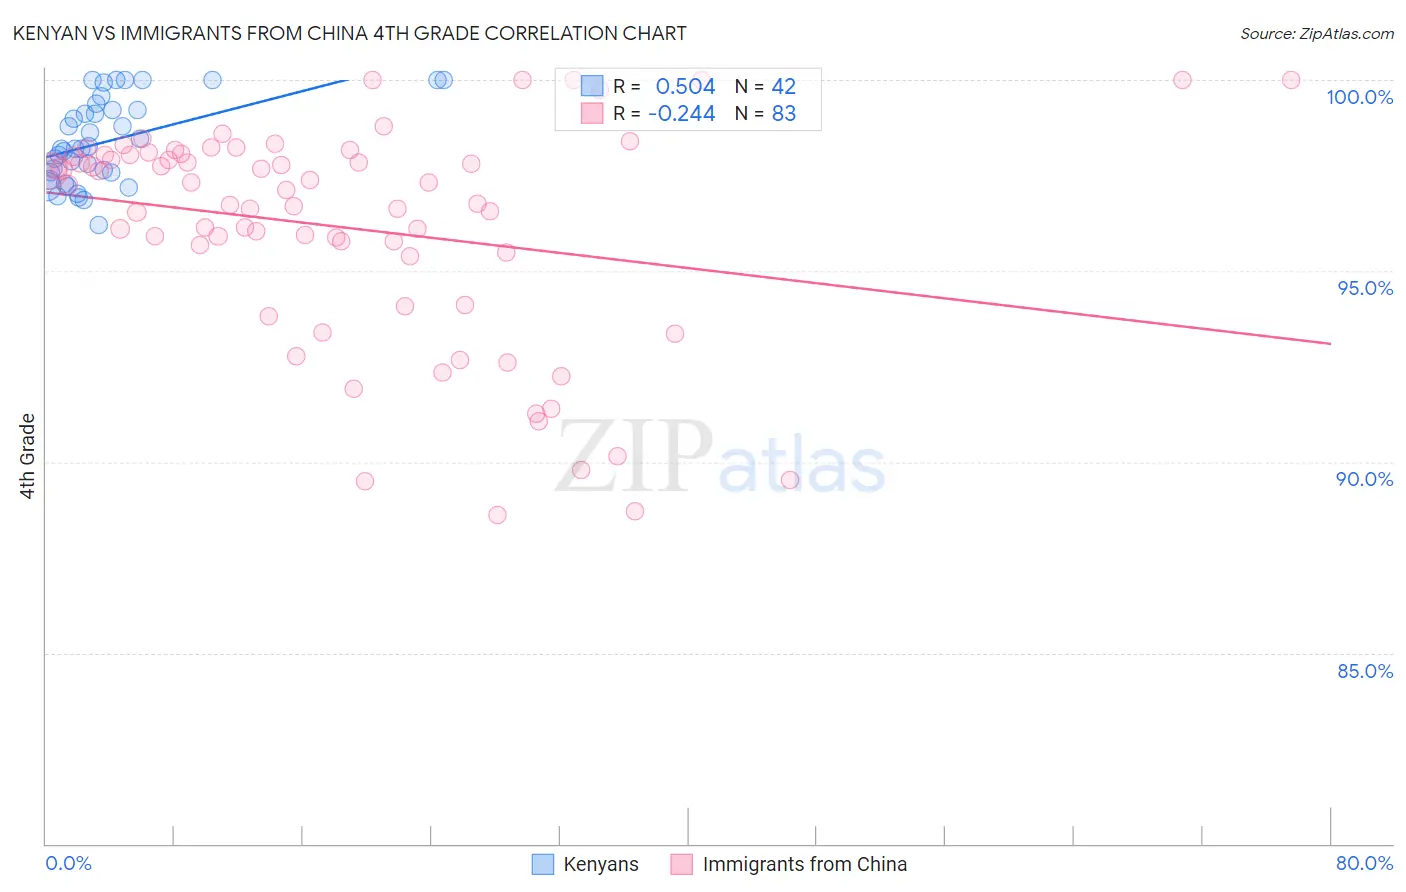
Kenyan vs Immigrants from China 4th Grade Correlation Chart
The statistical analysis conducted on geographies consisting of 168,244,481 people shows a substantial positive correlation between the proportion of Kenyans and percentage of population with at least 4th grade education in the United States with a correlation coefficient (R) of 0.504 and weighted average of 97.5%. Similarly, the statistical analysis conducted on geographies consisting of 457,082,957 people shows a weak negative correlation between the proportion of Immigrants from China and percentage of population with at least 4th grade education in the United States with a correlation coefficient (R) of -0.244 and weighted average of 97.0%, a difference of 0.59%.
4th Grade Correlation Summary
| Measurement | Kenyan | Immigrants from China |
| Minimum | 96.2% | 88.6% |
| Maximum | 100.0% | 100.0% |
| Range | 3.8% | 11.4% |
| Mean | 98.4% | 96.1% |
| Median | 98.2% | 97.1% |
| Interquartile 25% (IQ1) | 97.6% | 95.4% |
| Interquartile 75% (IQ3) | 99.2% | 98.0% |
| Interquartile Range (IQR) | 1.6% | 2.7% |
| Standard Deviation (Sample) | 1.1% | 2.9% |
| Standard Deviation (Population) | 1.1% | 2.9% |
Similar Demographics by 4th Grade
Demographics Similar to Kenyans by 4th Grade
In terms of 4th grade, the demographic groups most similar to Kenyans are Immigrants from Poland (97.5%, a difference of 0.0%), Immigrants from Belarus (97.5%, a difference of 0.0%), Immigrants from Iran (97.6%, a difference of 0.010%), Ugandan (97.6%, a difference of 0.010%), and Venezuelan (97.6%, a difference of 0.010%).
| Demographics | Rating | Rank | 4th Grade |
| Immigrants | Italy | 63.7 /100 | #159 | Good 97.6% |
| Apache | 61.3 /100 | #160 | Good 97.6% |
| Marshallese | 60.8 /100 | #161 | Good 97.6% |
| Bermudans | 60.5 /100 | #162 | Good 97.6% |
| Immigrants | Iran | 60.3 /100 | #163 | Good 97.6% |
| Ugandans | 58.9 /100 | #164 | Average 97.6% |
| Venezuelans | 58.7 /100 | #165 | Average 97.6% |
| Kenyans | 56.5 /100 | #166 | Average 97.5% |
| Immigrants | Poland | 55.9 /100 | #167 | Average 97.5% |
| Immigrants | Belarus | 55.8 /100 | #168 | Average 97.5% |
| Chileans | 54.4 /100 | #169 | Average 97.5% |
| Immigrants | Spain | 51.8 /100 | #170 | Average 97.5% |
| Brazilians | 51.5 /100 | #171 | Average 97.5% |
| Immigrants | Sri Lanka | 51.1 /100 | #172 | Average 97.5% |
| Immigrants | Korea | 50.6 /100 | #173 | Average 97.5% |
Demographics Similar to Immigrants from China by 4th Grade
In terms of 4th grade, the demographic groups most similar to Immigrants from China are Immigrants from Nigeria (97.0%, a difference of 0.0%), Taiwanese (97.0%, a difference of 0.010%), Armenian (97.0%, a difference of 0.010%), Ghanaian (97.0%, a difference of 0.010%), and Immigrants from Jamaica (97.0%, a difference of 0.020%).
| Demographics | Rating | Rank | 4th Grade |
| Immigrants | Ethiopia | 0.4 /100 | #259 | Tragic 97.0% |
| Immigrants | Sierra Leone | 0.4 /100 | #260 | Tragic 97.0% |
| Immigrants | South America | 0.4 /100 | #261 | Tragic 97.0% |
| West Indians | 0.4 /100 | #262 | Tragic 97.0% |
| Immigrants | Jamaica | 0.3 /100 | #263 | Tragic 97.0% |
| Taiwanese | 0.3 /100 | #264 | Tragic 97.0% |
| Armenians | 0.3 /100 | #265 | Tragic 97.0% |
| Immigrants | China | 0.3 /100 | #266 | Tragic 97.0% |
| Immigrants | Nigeria | 0.3 /100 | #267 | Tragic 97.0% |
| Ghanaians | 0.2 /100 | #268 | Tragic 97.0% |
| Immigrants | Uzbekistan | 0.2 /100 | #269 | Tragic 96.9% |
| Cubans | 0.2 /100 | #270 | Tragic 96.9% |
| Immigrants | Peru | 0.1 /100 | #271 | Tragic 96.9% |
| Fijians | 0.1 /100 | #272 | Tragic 96.9% |
| Immigrants | Cameroon | 0.1 /100 | #273 | Tragic 96.9% |