Immigrants from Pakistan vs Chilean High School Diploma
COMPARE
Immigrants from Pakistan
Chilean
High School Diploma
High School Diploma Comparison
Immigrants from Pakistan
Chileans
89.3%
HIGH SCHOOL DIPLOMA
62.5/ 100
METRIC RATING
158th/ 347
METRIC RANK
89.6%
HIGH SCHOOL DIPLOMA
79.0/ 100
METRIC RATING
141st/ 347
METRIC RANK
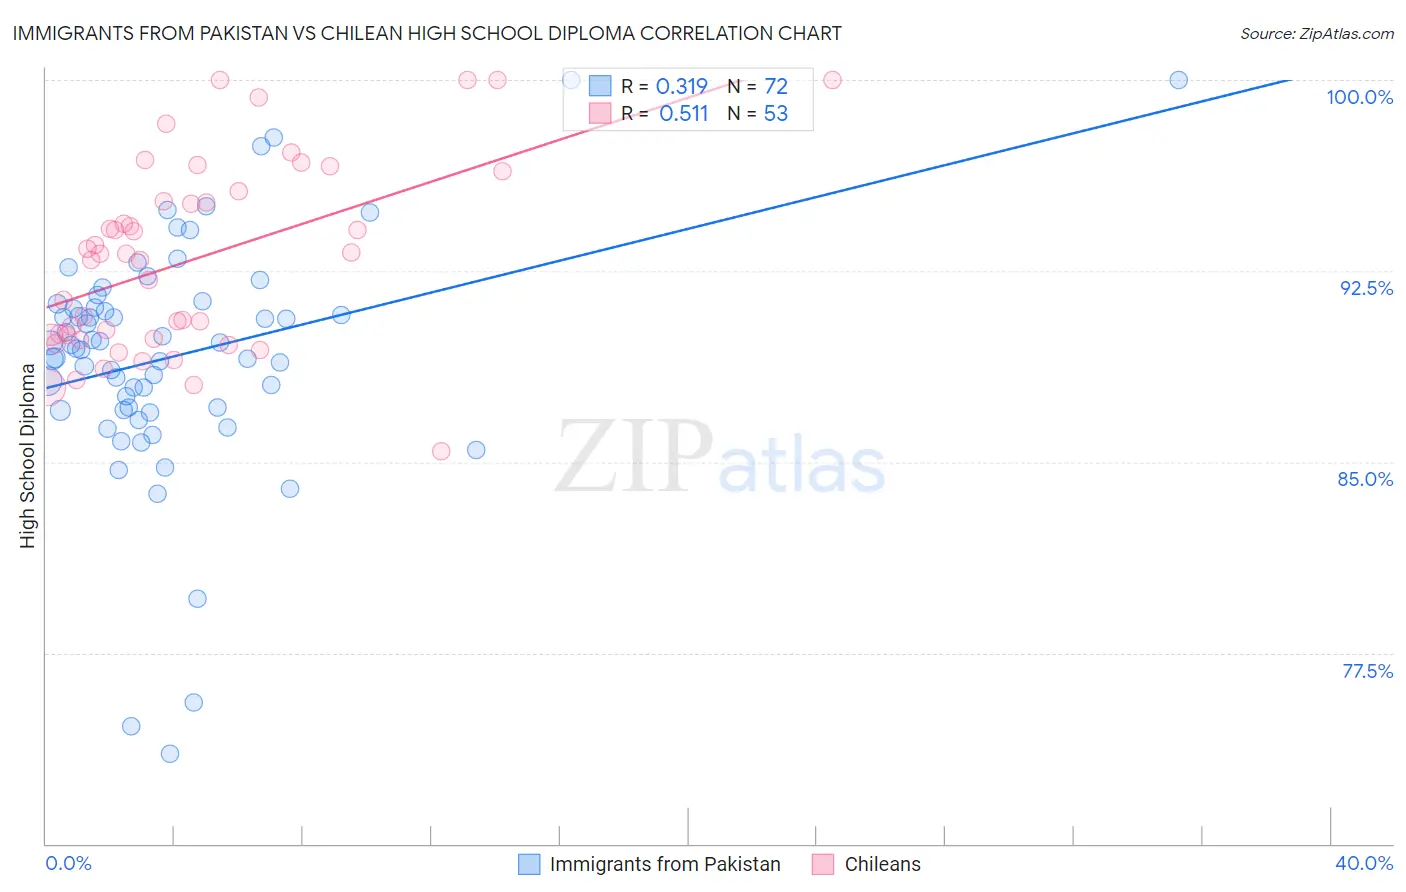
Immigrants from Pakistan vs Chilean High School Diploma Correlation Chart
The statistical analysis conducted on geographies consisting of 283,913,061 people shows a mild positive correlation between the proportion of Immigrants from Pakistan and percentage of population with at least high school diploma education in the United States with a correlation coefficient (R) of 0.319 and weighted average of 89.3%. Similarly, the statistical analysis conducted on geographies consisting of 256,681,007 people shows a substantial positive correlation between the proportion of Chileans and percentage of population with at least high school diploma education in the United States with a correlation coefficient (R) of 0.511 and weighted average of 89.6%, a difference of 0.31%.
High School Diploma Correlation Summary
| Measurement | Immigrants from Pakistan | Chilean |
| Minimum | 73.5% | 85.4% |
| Maximum | 100.0% | 100.0% |
| Range | 26.5% | 14.6% |
| Mean | 89.2% | 93.0% |
| Median | 89.5% | 93.2% |
| Interquartile 25% (IQ1) | 87.1% | 89.9% |
| Interquartile 75% (IQ3) | 91.1% | 95.4% |
| Interquartile Range (IQR) | 4.1% | 5.5% |
| Standard Deviation (Sample) | 4.7% | 3.7% |
| Standard Deviation (Population) | 4.7% | 3.6% |
Demographics Similar to Immigrants from Pakistan and Chileans by High School Diploma
In terms of high school diploma, the demographic groups most similar to Immigrants from Pakistan are Immigrants from China (89.3%, a difference of 0.010%), Immigrants from Malaysia (89.3%, a difference of 0.020%), Immigrants from Argentina (89.4%, a difference of 0.050%), Immigrants from Northern Africa (89.4%, a difference of 0.060%), and Alsatian (89.4%, a difference of 0.070%). Similarly, the demographic groups most similar to Chileans are Indian (Asian) (89.6%, a difference of 0.0%), Pakistani (89.6%, a difference of 0.020%), Immigrants from Kenya (89.6%, a difference of 0.020%), Immigrants from Egypt (89.6%, a difference of 0.050%), and Immigrants from Brazil (89.5%, a difference of 0.050%).
| Demographics | Rating | Rank | High School Diploma |
| Kenyans | 81.4 /100 | #139 | Excellent 89.6% |
| Immigrants | Egypt | 81.2 /100 | #140 | Excellent 89.6% |
| Chileans | 79.0 /100 | #141 | Good 89.6% |
| Indians (Asian) | 78.8 /100 | #142 | Good 89.6% |
| Pakistanis | 78.3 /100 | #143 | Good 89.6% |
| Immigrants | Kenya | 78.0 /100 | #144 | Good 89.6% |
| Immigrants | Brazil | 76.6 /100 | #145 | Good 89.5% |
| Immigrants | Spain | 76.2 /100 | #146 | Good 89.5% |
| Iraqis | 73.9 /100 | #147 | Good 89.5% |
| Immigrants | Lebanon | 73.4 /100 | #148 | Good 89.5% |
| Immigrants | Poland | 72.9 /100 | #149 | Good 89.5% |
| Argentineans | 72.3 /100 | #150 | Good 89.5% |
| Paraguayans | 71.4 /100 | #151 | Good 89.5% |
| Asians | 70.7 /100 | #152 | Good 89.4% |
| Immigrants | Iraq | 68.7 /100 | #153 | Good 89.4% |
| Alsatians | 66.8 /100 | #154 | Good 89.4% |
| Immigrants | Northern Africa | 66.4 /100 | #155 | Good 89.4% |
| Immigrants | Argentina | 65.5 /100 | #156 | Good 89.4% |
| Immigrants | Malaysia | 63.5 /100 | #157 | Good 89.3% |
| Immigrants | Pakistan | 62.5 /100 | #158 | Good 89.3% |
| Immigrants | China | 62.0 /100 | #159 | Good 89.3% |